Data Point
New-Vehicle Prices Increase for Fifth Straight Month, Set Record Again in August, According to Kelley Blue Book
Monday September 12, 2022
Article Highlights
- Inventory improves year over year but remains historically low; incentives decreased slightly in August over July, averaging only 2.3% of the average transaction price.
- Luxury share remains elevated – at 17.5% of sales – pushing industry average transaction price higher.
- Non-luxury vehicle buyers paid on average $1,102 above sticker price, an increase from the prior month.
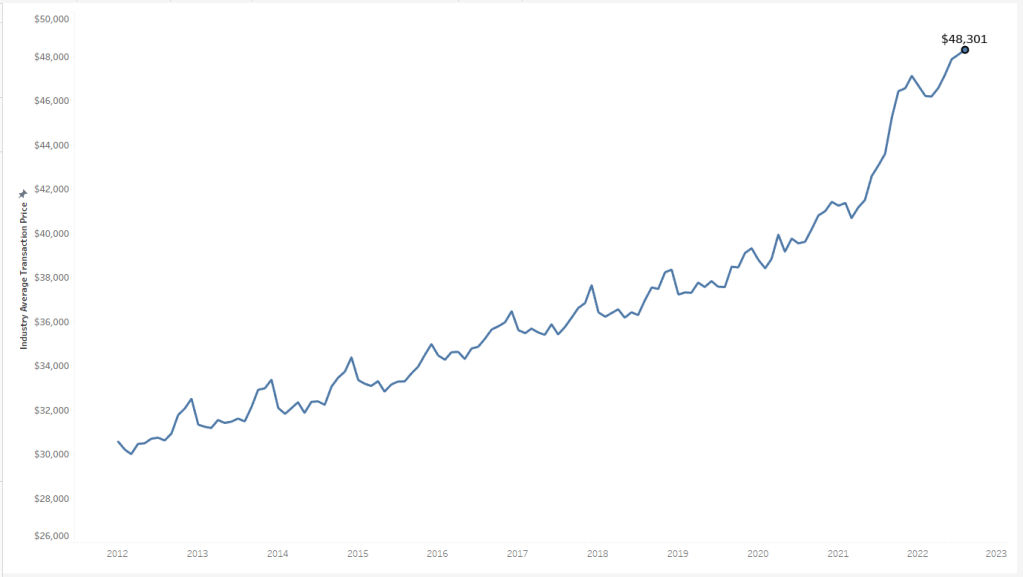
The average price paid for a new vehicle in the U.S. in August topped July’s record and kept the average transaction price (ATP) solidly above the $48,000 mark, according to new data released today by Kelley Blue Book, a Cox Automotive company. The Kelley Blue Book new-vehicle ATP increased to $48,301 in August 2022, beating the previous high of $48,080 set in the prior month. August 2022 prices rose 0.5% ($222) month over month from July, and 10.8% ($4,712) year over year from August 2021.
NEW-VEHICLE AVERAGE TRANSACTION PRICE

New-vehicle inventory days’ supply held steady in the mid-to-high 30s during the summer and is showing signs of increasing. In August, days’ supply was 43% higher than it was in the same timeframe of 2021, when inventory shortages first started to impact the market. Still, with roughly 1.2 million units in inventory in the U.S., new-vehicle inventory remains significantly below levels seen in 2020 and 2019. In the face of tight inventory and high prices, new-vehicle sales remain depressed, averaging just 1.1 million units per month in 2022. For comparison, sales in the first eight months of 2019 averaged 1.4 million per month.
Hyundai, Land Rover, Honda and Kia continue to show the most price strength in the market, transacting between 5-and-9% over sticker last month. Ram, Volvo, Lincoln, Buick, and the smaller Italian brands Alfa Romeo and Fiat showed the least price strength, selling 1% or more below MSRP in August. Understandably, the brands with the lowest price strength also have the highest days’ supply of vehicles.
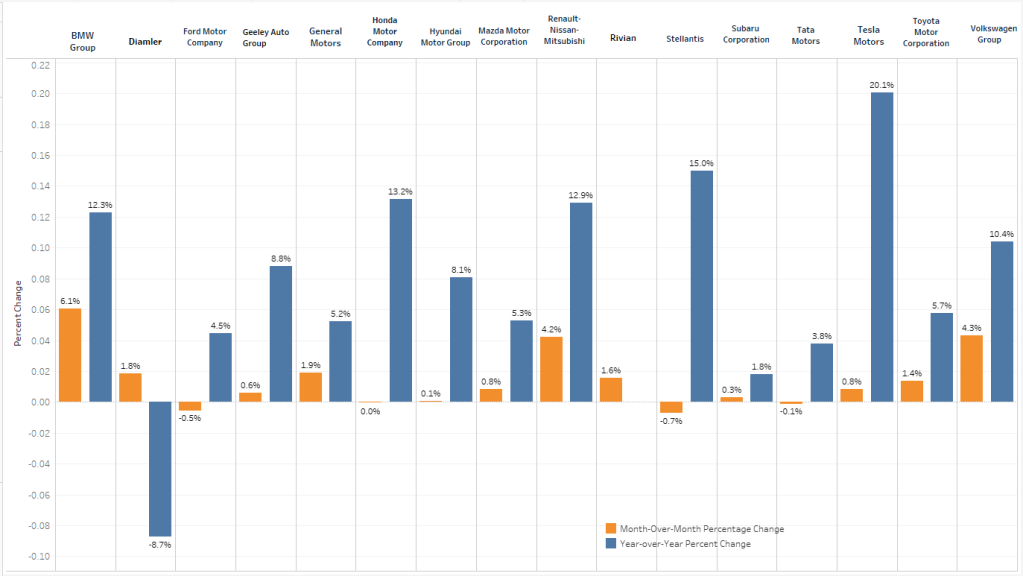
PRICE CHANGE PERCENTAGE BY AUTOMAKER

“Prices are still high and climbing incrementally every month,” said Rebecca Rydzewski, research manager of economic and industry insights for Cox Automotive. “New-vehicle inventory levels have been rising through August, now reaching the highest level since June 2021. However, supply of popular segments – like subcompacts, hybrids and EVs – still remain very low. Automakers are focusing on building and selling high-margin vehicles. Essentially, the product mix is the primary factor keeping prices high.”
The average price paid for a new non-luxury vehicle last month was $44,559, up $132 month over month and a record for non-luxury vehicles, beating out the high set the prior month. Car shoppers in the non-luxury segment paid on average $1,102 above sticker price, an increase from the prior month. Non-luxury shoppers paid nearly 2% above MSRP in August, compared to 1% above MSRP a year ago. One bright spot for buyers: truck shoppers paid $142 below sticker in August.
In August 2022, the average luxury buyer paid $65,935 for a new vehicle, up $878 from the prior month, when luxury ATPs hit a record $65,057. Luxury buyers continue to pay more than MSRP for new vehicles, although prices are trending closer to sticker prices. Luxury vehicle share remains historically high as well, although share decreased to 17.5% of total sales in August from 17.7% in July. The high share of luxury sales is helping to push the overall industry ATP higher.
The average price paid for a new electric vehicle (EV) rose in August by 1.7% compared to July and increased by 15.6% versus a year ago. The average price for a new electric vehicle – over $66,000, according to Kelley Blue Book estimates – remains well above the industry average, aligning more with luxury prices versus mainstream prices.
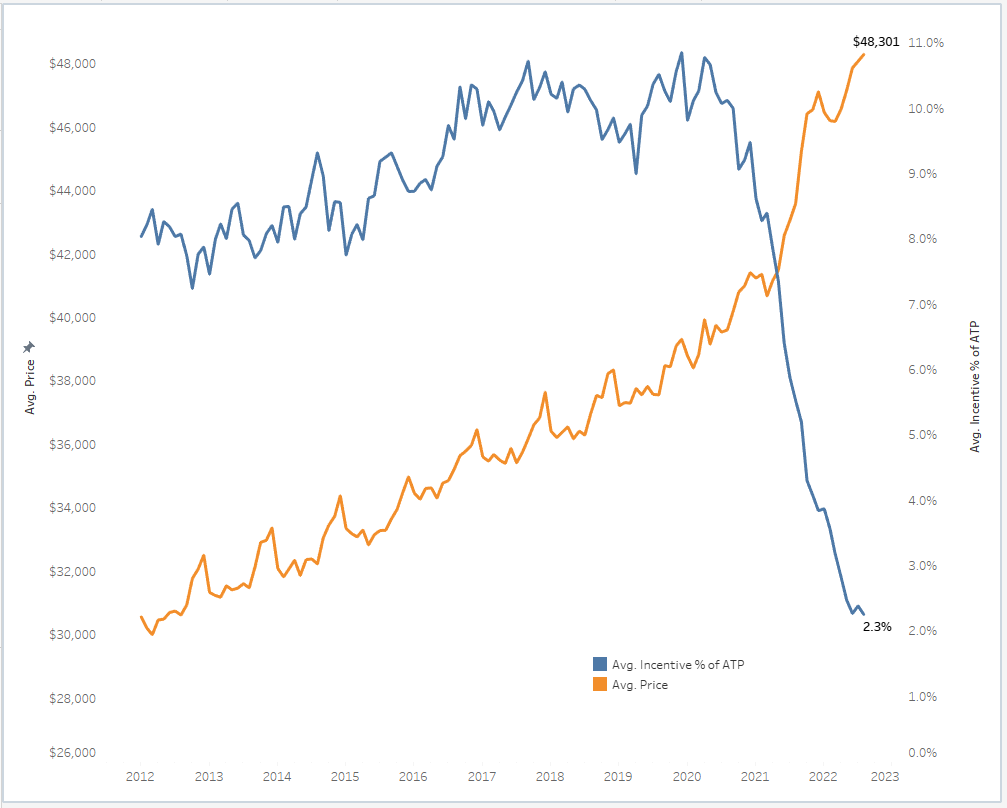
INDUSTRY AVERAGE TRANSACTION PRICE VERSUS INDUSTRY AVERAGE INCENTIVE SPEND AS % OF ATP

Incentives decreased slightly in August versus July, remaining historically low at only 2.3% of the average transaction price. A year ago, incentives averaged 5.5% of ATP. Full-size cars and luxury cars had the highest incentives in August, while high-performance cars, vans and electric vehicles had the lowest incentives. Brands with higher inventory levels offered higher incentives in August. The Stellantis brands, for example, generally had higher than average inventory in August and also higher than average incentives. While still low from a historical perspective, Stellantis’ incentives in August averaged 4.4% of ATP, up from 4.1% in July.
