
ATLANTA, Feb. 13, 2023 – The average transaction price (ATP) of a new vehicle in the U.S. declined slightly in January 2023 to $49,388, a decrease of 0.6% ($310) from December’s record high and up 5.9% ($2,768) from levels one year earlier. New-vehicle inventory levels are increasing from historic lows in early 2022, but prices remain elevated, according to data released today by Kelley Blue Book, a Cox Automotive company.
NEW-VEHICLE AVERAGE TRANSACTION PRICE

According to Kelley Blue Book calculations, new-vehicle ATPs have been above the average manufacturer‘s suggested retail price (MSRP), also known as the sticker price, for more than a year. In January 2023, the average price paid was $310 more than the average sticker, as prices continue to trend downward relative to sticker price. A year ago, in January 2022, the average ATP was more than $900 above the average MSRP. Sales volumes last month were up year over year by more than 6% but down from December, thanks in part to improved supply and added fleet sales. Elevated retail prices and high loan rates are putting downward pressure on retail sales.
“The transaction data from January indicates that overall prices are no longer increasing like they were a year ago,” said Rebecca Rydzewski, research manager of economic and industry insights for Cox Automotive. “Both luxury and non-luxury prices were down month over month, but the mix of luxury vehicle sales last month – at a record high near 20% – helped keep the overall average price elevated.”
Incentives remain low compared to pre-pandemic years, but they are trending upwards as inventory improves. The most affordable vehicles – compact cars, compact SUVs and subcompact cars – had incentives between 3% to 4%, which is above industry average. High loan rates and continued inflationary pressures appear to be hurting the lower part of the market, so automakers are more focused on luxury and higher-end models.
Average Prices for Non-Luxury Cars Decline from the Record High in December
The average price paid for a new non-luxury vehicle in January was $45,344—a decline of $271 compared to December. The majority of non-luxury brands – including Chevrolet, Chrysler, Dodge, Ford, Honda, Kia, Mazda, and Subaru – all saw ATP declines between 0.3% to 4.9% month over month in January. This correlates with higher incentives helping to push prices down. Toyota and Ram showed the most price strength in the non-luxury market, transacting between 2% and 5% over sticker price in January.
PRICE CHANGE PERCENTAGE BY AUTOMAKER

Luxury Share Hits Record High, While Average Prices Fall in January
Strong luxury vehicle sales have been a primary reason for overall elevated new-vehicle prices. This remained the case in January when luxury vehicle share jumped to a record 19.6% of total sales, up from 18.6% in December. The high share of luxury sales helps to push the overall industry ATP higher, even though luxury ATP declined.
In January 2023, the average luxury buyer paid $65,953 for a new vehicle, down $1,560 from December. Buyers continue to pay over MSRP for new luxury vehicles, but not by much. Luxury vehicle ATPs were a mixed bag in January, with luxury cars, luxury compact SUVs and luxury mid-size SUVs showing price declines between 0.4% and 1.4%. Entry-level luxury cars, high-end luxury cars and luxury full-size SUVs all saw price increases between 1.3% and 4.8%.
Mercedes-Benz and Lexus showed the most price strength in the luxury market, transacting between 1.4% to 4.8% over sticker price last month. Luxury brands Audi, BMW, Infiniti, Lincoln, and Volvo showed the least price strength, selling 1% or more below MSRP in January.
Led by Tesla, Electric Vehicle Prices Decreased Notably in January, Continuing a Downward Trend
The average price paid for a new EV decreased in January by $3,363 (down 5.4%) compared to December. The average new EV sold for $58,725, according to Kelley Blue Book estimates, and is still well above the industry average. The drop in pricing was driven by significant price cuts from Tesla, which commands roughly two-thirds of the EV market. Tesla’s average transaction prices decreased $5,440, down 8.4% month over month and down 5.5% year over year. Lower prices likely helped Tesla deliver higher sales volumes. According to Kelley Blue Book estimates, Tesla sales in January increased year over year by more than 30%.
Auto Incentives Offered by Manufacturers Remain at Historically Low Level but Are Increasing
Incentives increased in January 2023 to 2.8% of the average transaction price, compared to 2.7% in December. In January 2021, before the new-vehicle inventory decline, incentives averaged 8.6% of ATP, according to Kelley Blue Book estimates.
INDUSTRY AVERAGE TRANSACTION PRICE VERSUS INDUSTRY AVERAGE INCENTIVE SPEND AS % OF ATP
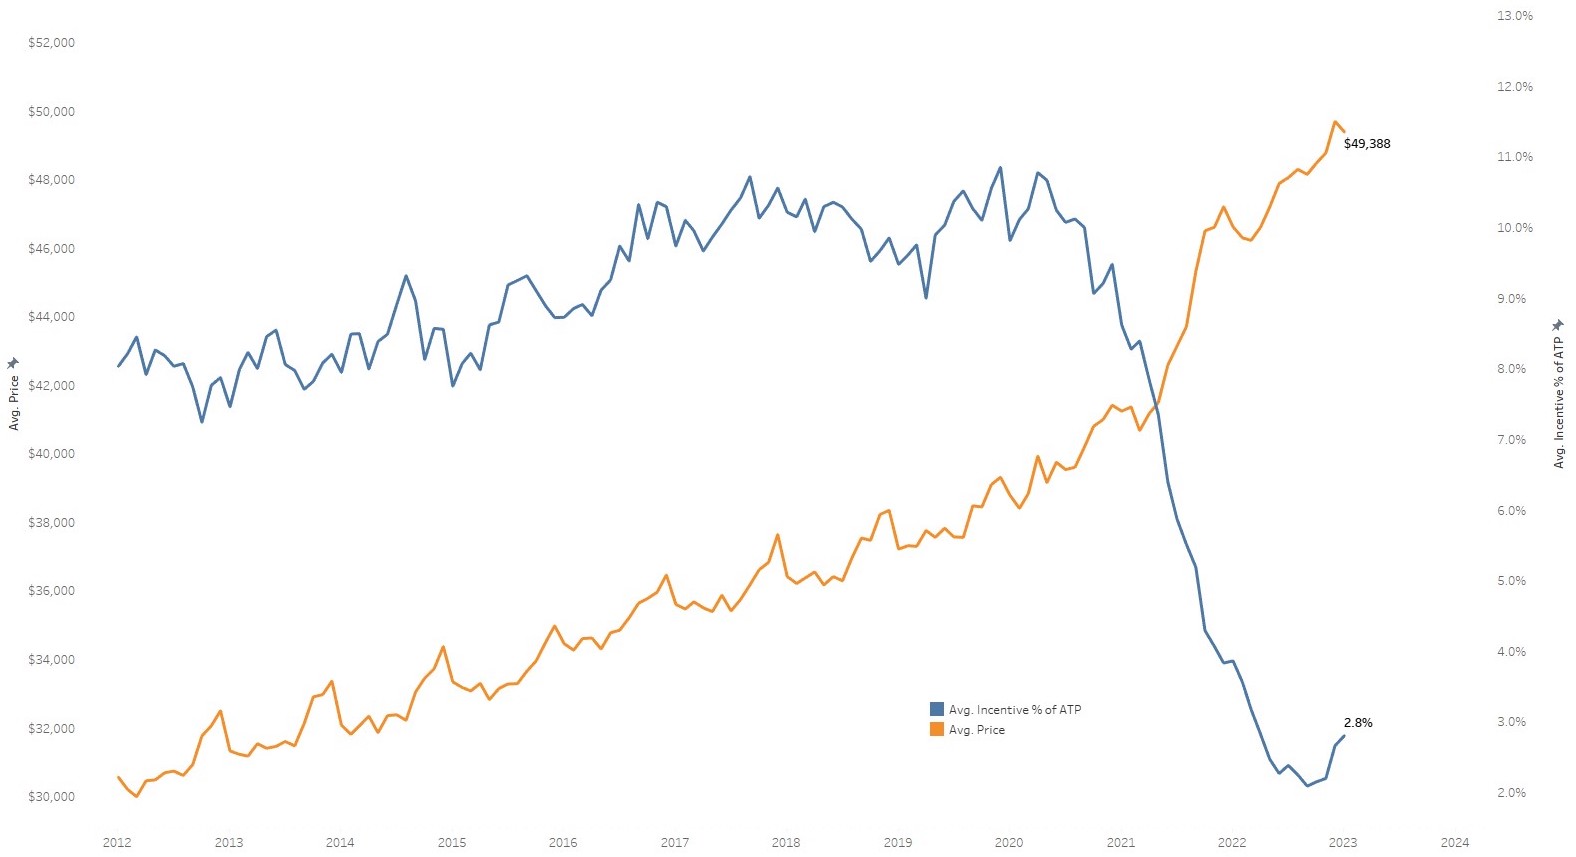
Luxury cars had the highest incentives in January at 6.2% of ATP. Meanwhile, vans and minivans had the lowest incentives, with less than 1% of ATP.


