
Revised, April 13, 2023 – New-vehicle supply closed February higher than it ended January despite surprisingly strong sales, according to Cox Automotive’s analysis of vAuto Available Inventory data. The average listing price edged lower.
1.80M
Total Inventory
as of Feb. 27, 2023
57
Days’ Supply
$47,257
Average Listing Price
The total U.S. supply of available unsold new vehicles stood at 1.80 million units at the end of February, compared with an upwardly revised 1.75 million vehicles at the end of January. Supply was up 68% from a year ago, or 730,000 units higher.
Days’ supply was 57, down one from the end of January but up 20 days compared with the end of February 2022. Historically, a 60 days’ supply across the industry had been considered normal and ideal.
The Cox Automotive days’ supply is based on the daily sales rate for the most recent 30-day period that ended February 27, when about 970,000 vehicles were sold, up 5% from the same period in 2022.
For the full calendar month of February, total new-vehicle sales were up 9% from a year ago for a seasonally adjusted annual rate of sales (SAAR) of 14.9 million, up from the 13.7 million a year ago but down from January’s surprisingly strong 15.9 million. Total sales were buoyed by double-digit increases in fleet sales, as has been the case for the past few months.
“Helped by improved inventory, new-vehicle sales are showing surprising strength, considering the relentless talk of a recession, growing economic headwinds, and continued inflation, especially in the form of high vehicle prices and continually rising interest rates,” said Charlie Chesbrough, Cox Automotive senior economist.
While inventory is up substantially from 2022 levels, it remains low by historical standards. At the end of pre-pandemic February 2019, the total supply was 3.78 million vehicles for a 115 days’ supply.
New-Vehicle Asking Prices Dipped in February
After stabilizing last fall and then rising in January, the average new-vehicle listing price – the asking price – dipped to $47,257 by the end of February. Still, the average price is up 6% from a year ago.
The average transaction price (ATP) – the price paid – in February slipped to $48,763, down $705, or 1%, from January. However, these are still high prices, nearly $2,500 higher, or 5% above the year-ago level, according to Kelley Blue Book.
With some brands and segments nearing pre-pandemic bloated inventory levels, discounting and incentives are rising. February incentives were 3% of the ATP, or on average, $1,474 per vehicle. That is the highest level since March 2022. Still, they are low by historical standards when they are as much as 10% of ATP.
“We expect to see incentives rise some, particularly on segments and brands with the heaviest inventories,” said Chesbrough. “Right now, it feels like automakers are waiting for the other guy to blink first.”
Supply Shows Wide Variation by Brand, Segment, Price and Region
At the close of February, the industry had non-luxury vehicle inventory totaling 1.53 million vehicles for a 56 days’ supply compared with 1.75 million vehicles for a 58 days’ supply at the end of January. The inventory of luxury vehicles (excluding uber luxury ones) stood at 271,591 units for a 60 days’ supply. That compares with 270,000 vehicles for a 61 days’ supply a month earlier.
Import non-luxury and luxury brands had the lowest inventories. The highest inventories were a mix of domestic brands, dominated by Stellantis’ brands, and a mix of luxury makes.
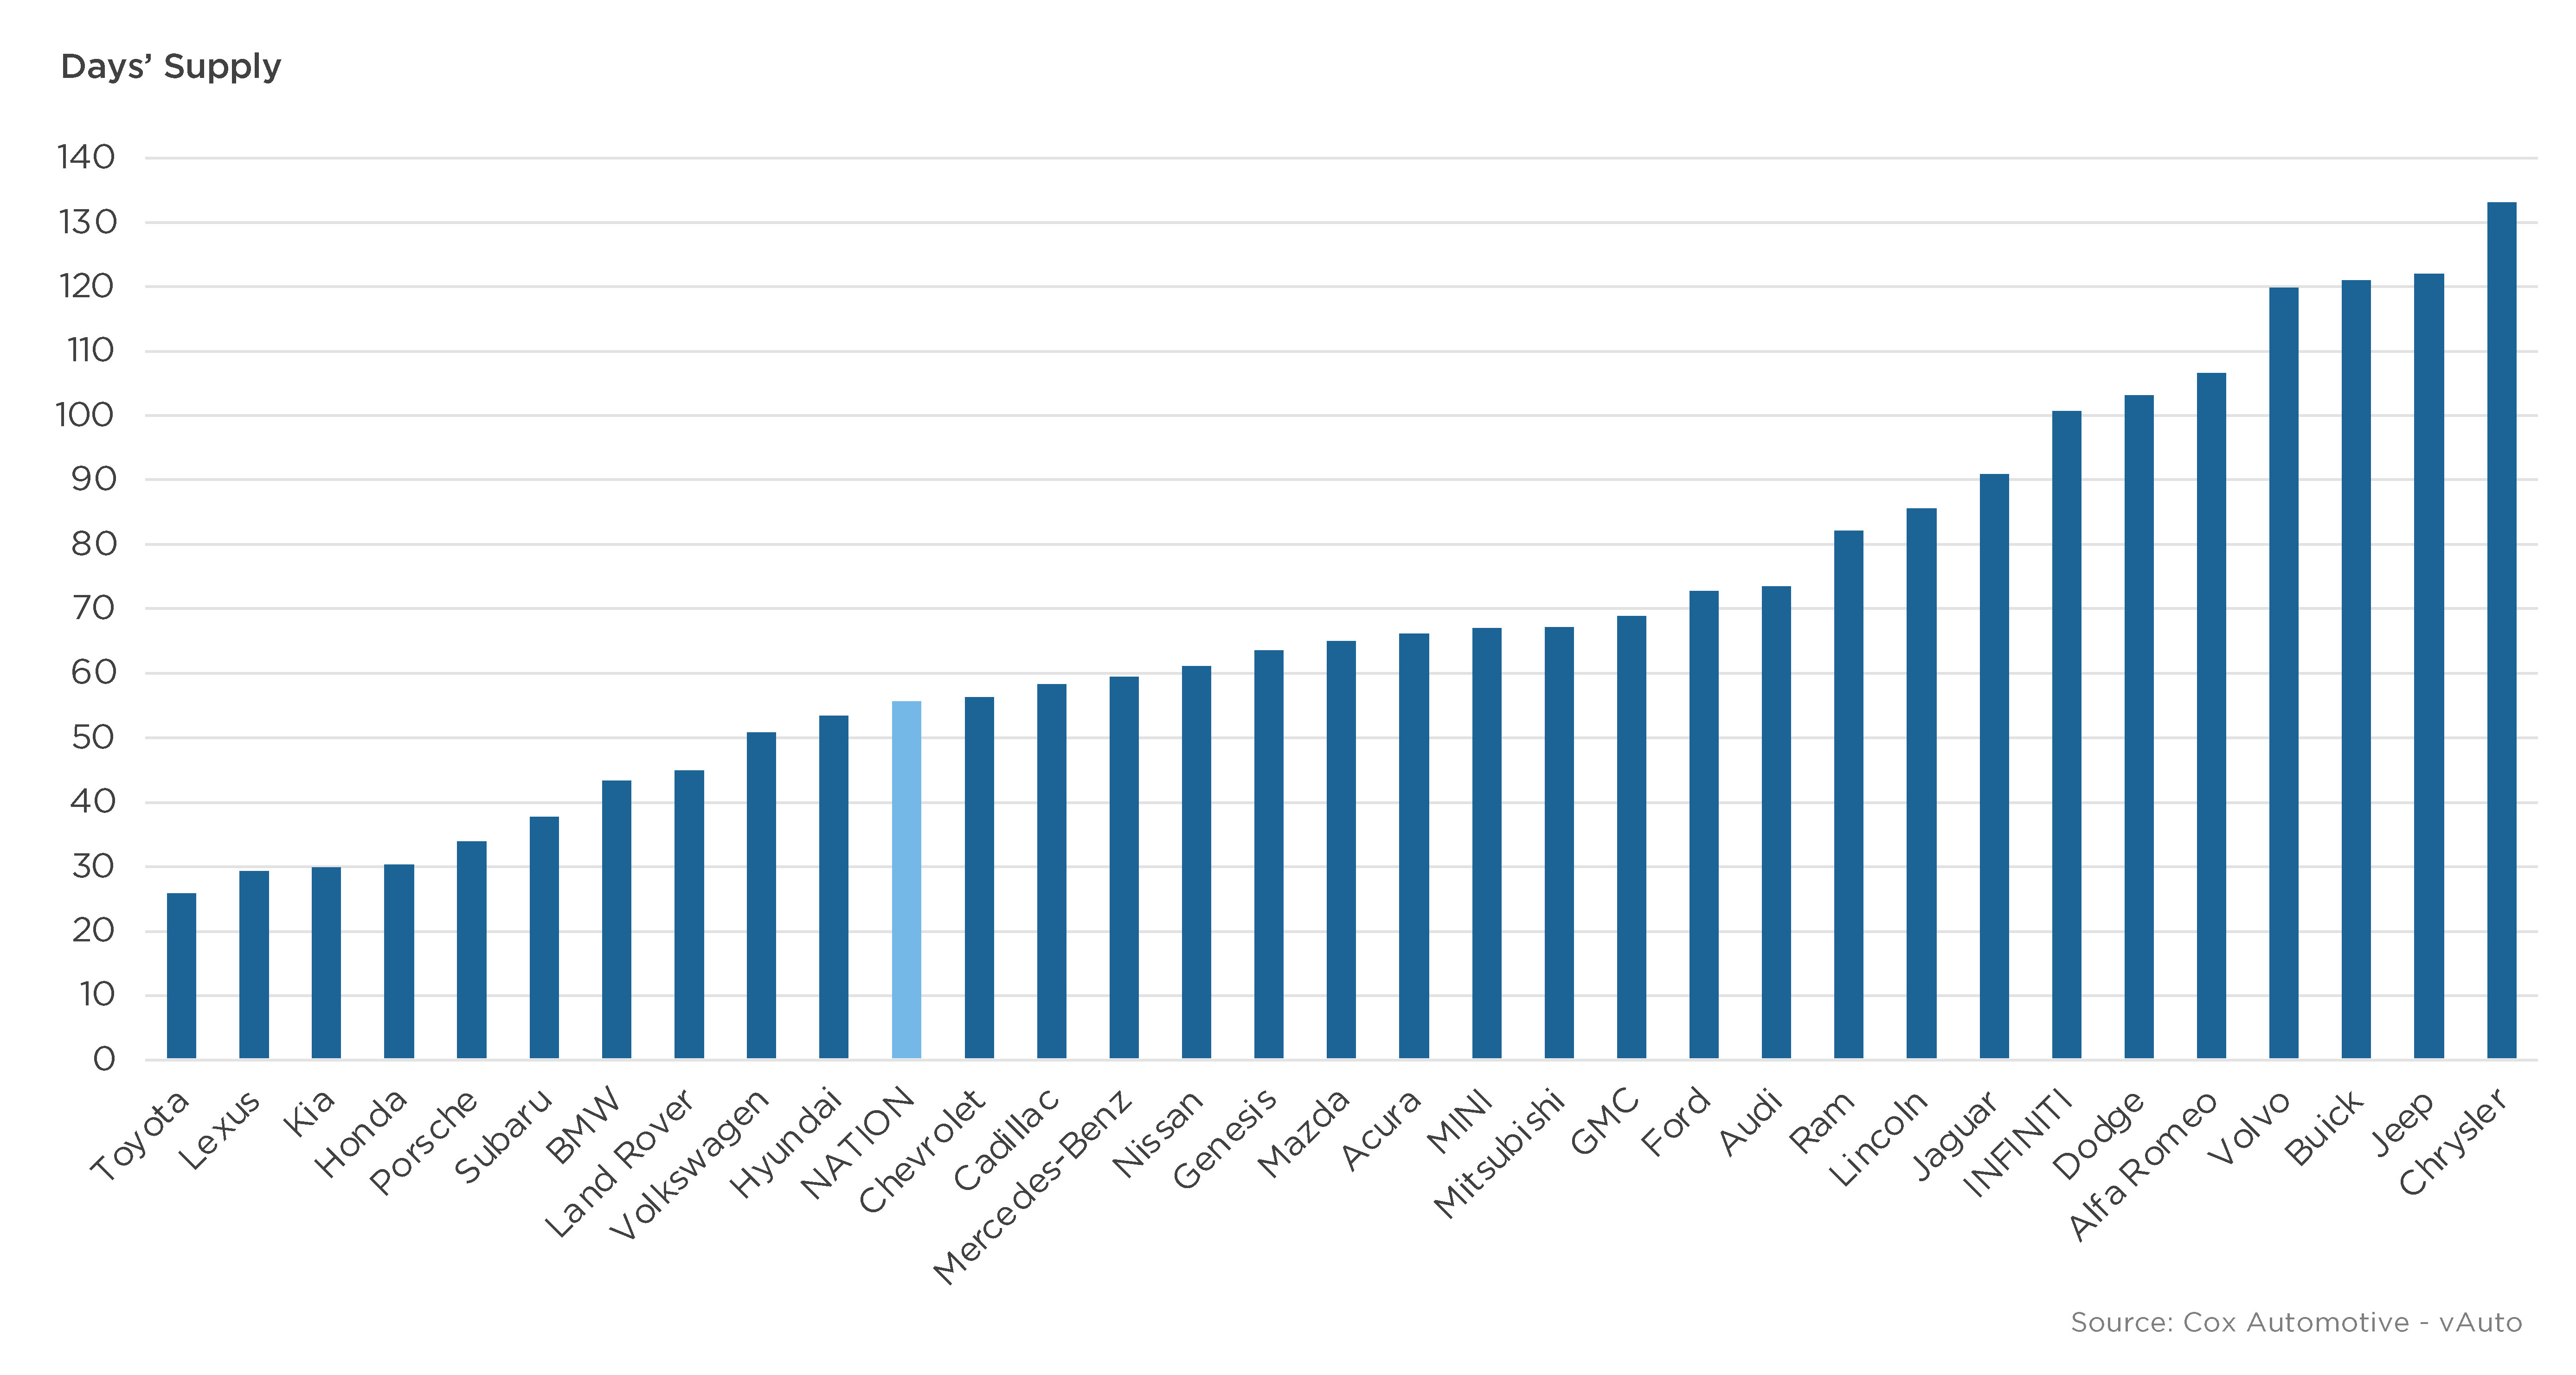
Non-luxury brands with the lowest inventory were Toyota, Kia and Honda, under 30 days’ supply, followed by Subaru, Volkswagen and Hyundai, all with below industry average supply. Luxury brands at the low end were Lexus and Porsche, with only 30 days’ supply, followed by BMW and Land Rover.
Non-luxury brands with the highest inventory were mostly Stellantis brands, with four among the top for supply. Chrysler was the highest with 133 days’ supply, followed by Jeep and Dodge. Buick, Volvo, Alfa Romeo and Infiniti were the luxury brands with the highest inventory. The seven brands with the highest supply had days’ supply over 100.
February Days’ Supply of Inventory By Brand
Cars popular with budget-minded Americans had the lowest supply, along with midsize trucks and compact SUVs. Large and/or expensive cars had the highest, followed by full-size pickup trucks.
Aside from low-volume, high-performance cars, vehicles with the lowest days’ supply are midsize, compact and subcompact cars. Supply for midsize trucks has dropped to the low end, likely due to the slow launch of the redesigned Chevrolet Colorado and GMC Canyon. Compact SUVs are also at the low end.
Except for niche uber luxury, full-size, luxury and sports cars had the highest inventory, followed by full-size pickup trucks at 79 days’ supply, which is down and not out of line for pickup trucks because they come in a wide array of configurations. Notably, niche segments show wild fluctuations in days’ supply due to low sales.
Of the 30 best-sellers for the 30 days that ended February 27, Honda CR-V, Toyota RAV4, Honda Civic, Kia Telluride and Honda Accord had the lowest inventory with days’ supply under 25. Of the 30 best-sellers, full-size pickup trucks from the Detroit Three had the biggest supply. The Ram 1500 had a 109 days’ supply. Chevrolet Silverado and Ford F-150 had days’ supply in the 90s.
By DMA, California and Southern DMAs had the lowest inventories. Northern ones had the highest. San Francisco-San Jose had the lowest inventory based on days’ supply, followed by Miami-Fort Lauderdale, Orlando-Daytona Beach, Los Angeles and Atlanta, all with less than 50 days’ supply. Minneapolis-St. Paul and Detroit had the highest supply at 70 days, followed by Denver and Chicago.
The lower the price category, the tighter the supply. Under $20,000, a segment with an active supply of just over 3,000 units had a 20 days’ supply. Between $20,000 and $40,000, days’ supply was 40 to 44. The 40,000 to $50,000 category had a 54 days’ supply. The $50,000 to $80,000 category had 70 to 74 days’ supply.
More insights are available from Cox Automotive on new-vehicle inventory, using a 30-day rolling sales methodology to calculate days’ supply.
Michelle Krebs is executive analyst at Cox Automotive.


