Data Point
Segment Shifts Drive Higher Average MSRP While Affordability Concerns Increase
Tuesday March 26, 2019
You can visualize the relentless rise of new-vehicle prices in the U.S. market in many ways. Average transaction price – ATP – is a common measure, showing the amount consumers pay for a vehicle, including all rebates and incentives. Or look to the average monthly loan payment for a new vehicle, which is currently more than $545 a month, up 4 percent from year-ago levels. Our own Kelley Blue Book team has multiple data points on vehicle prices, including the Fair Purchase Price, a weekly look at what consumers can reasonably expect to pay in their market for a specific make, model and year of any vehicle.
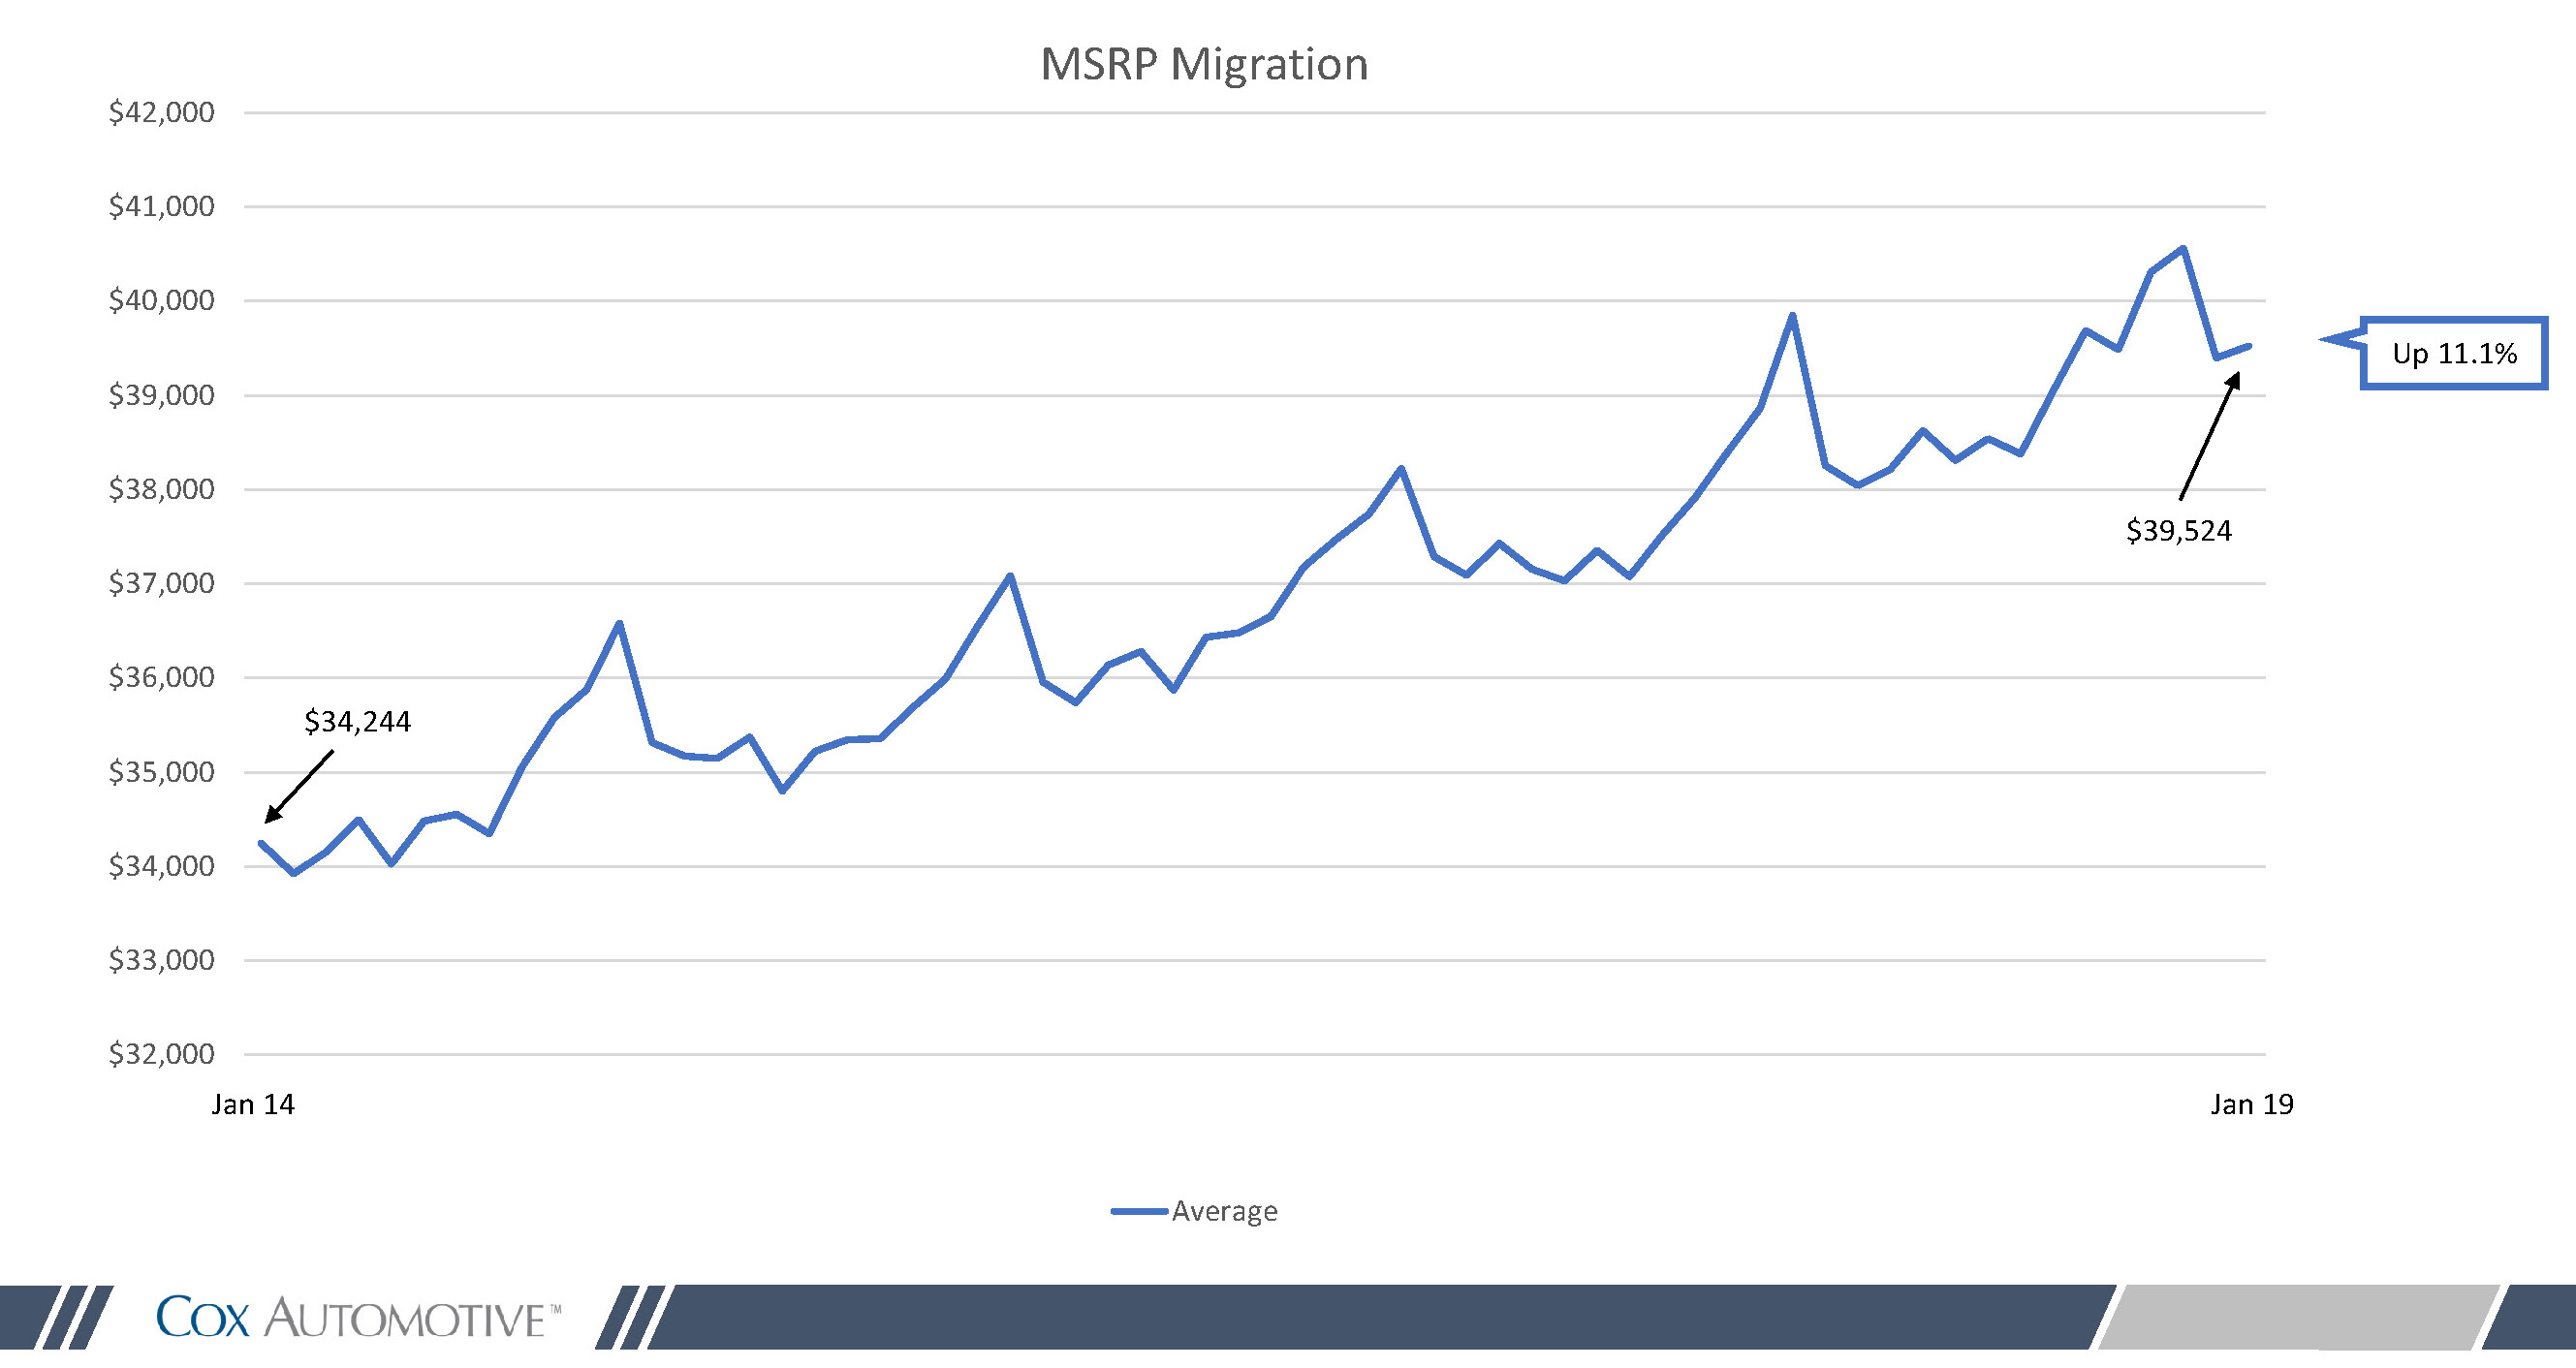
Vehicle price metrics mostly begin with the Manufacturer’s Suggested Retail Price (MSRP). This is the price automakers believe their new vehicles are worth—the starting point of every deal. And it’s been tracking upwards for years, reaching above $40,000 in recent month, the highest ever.
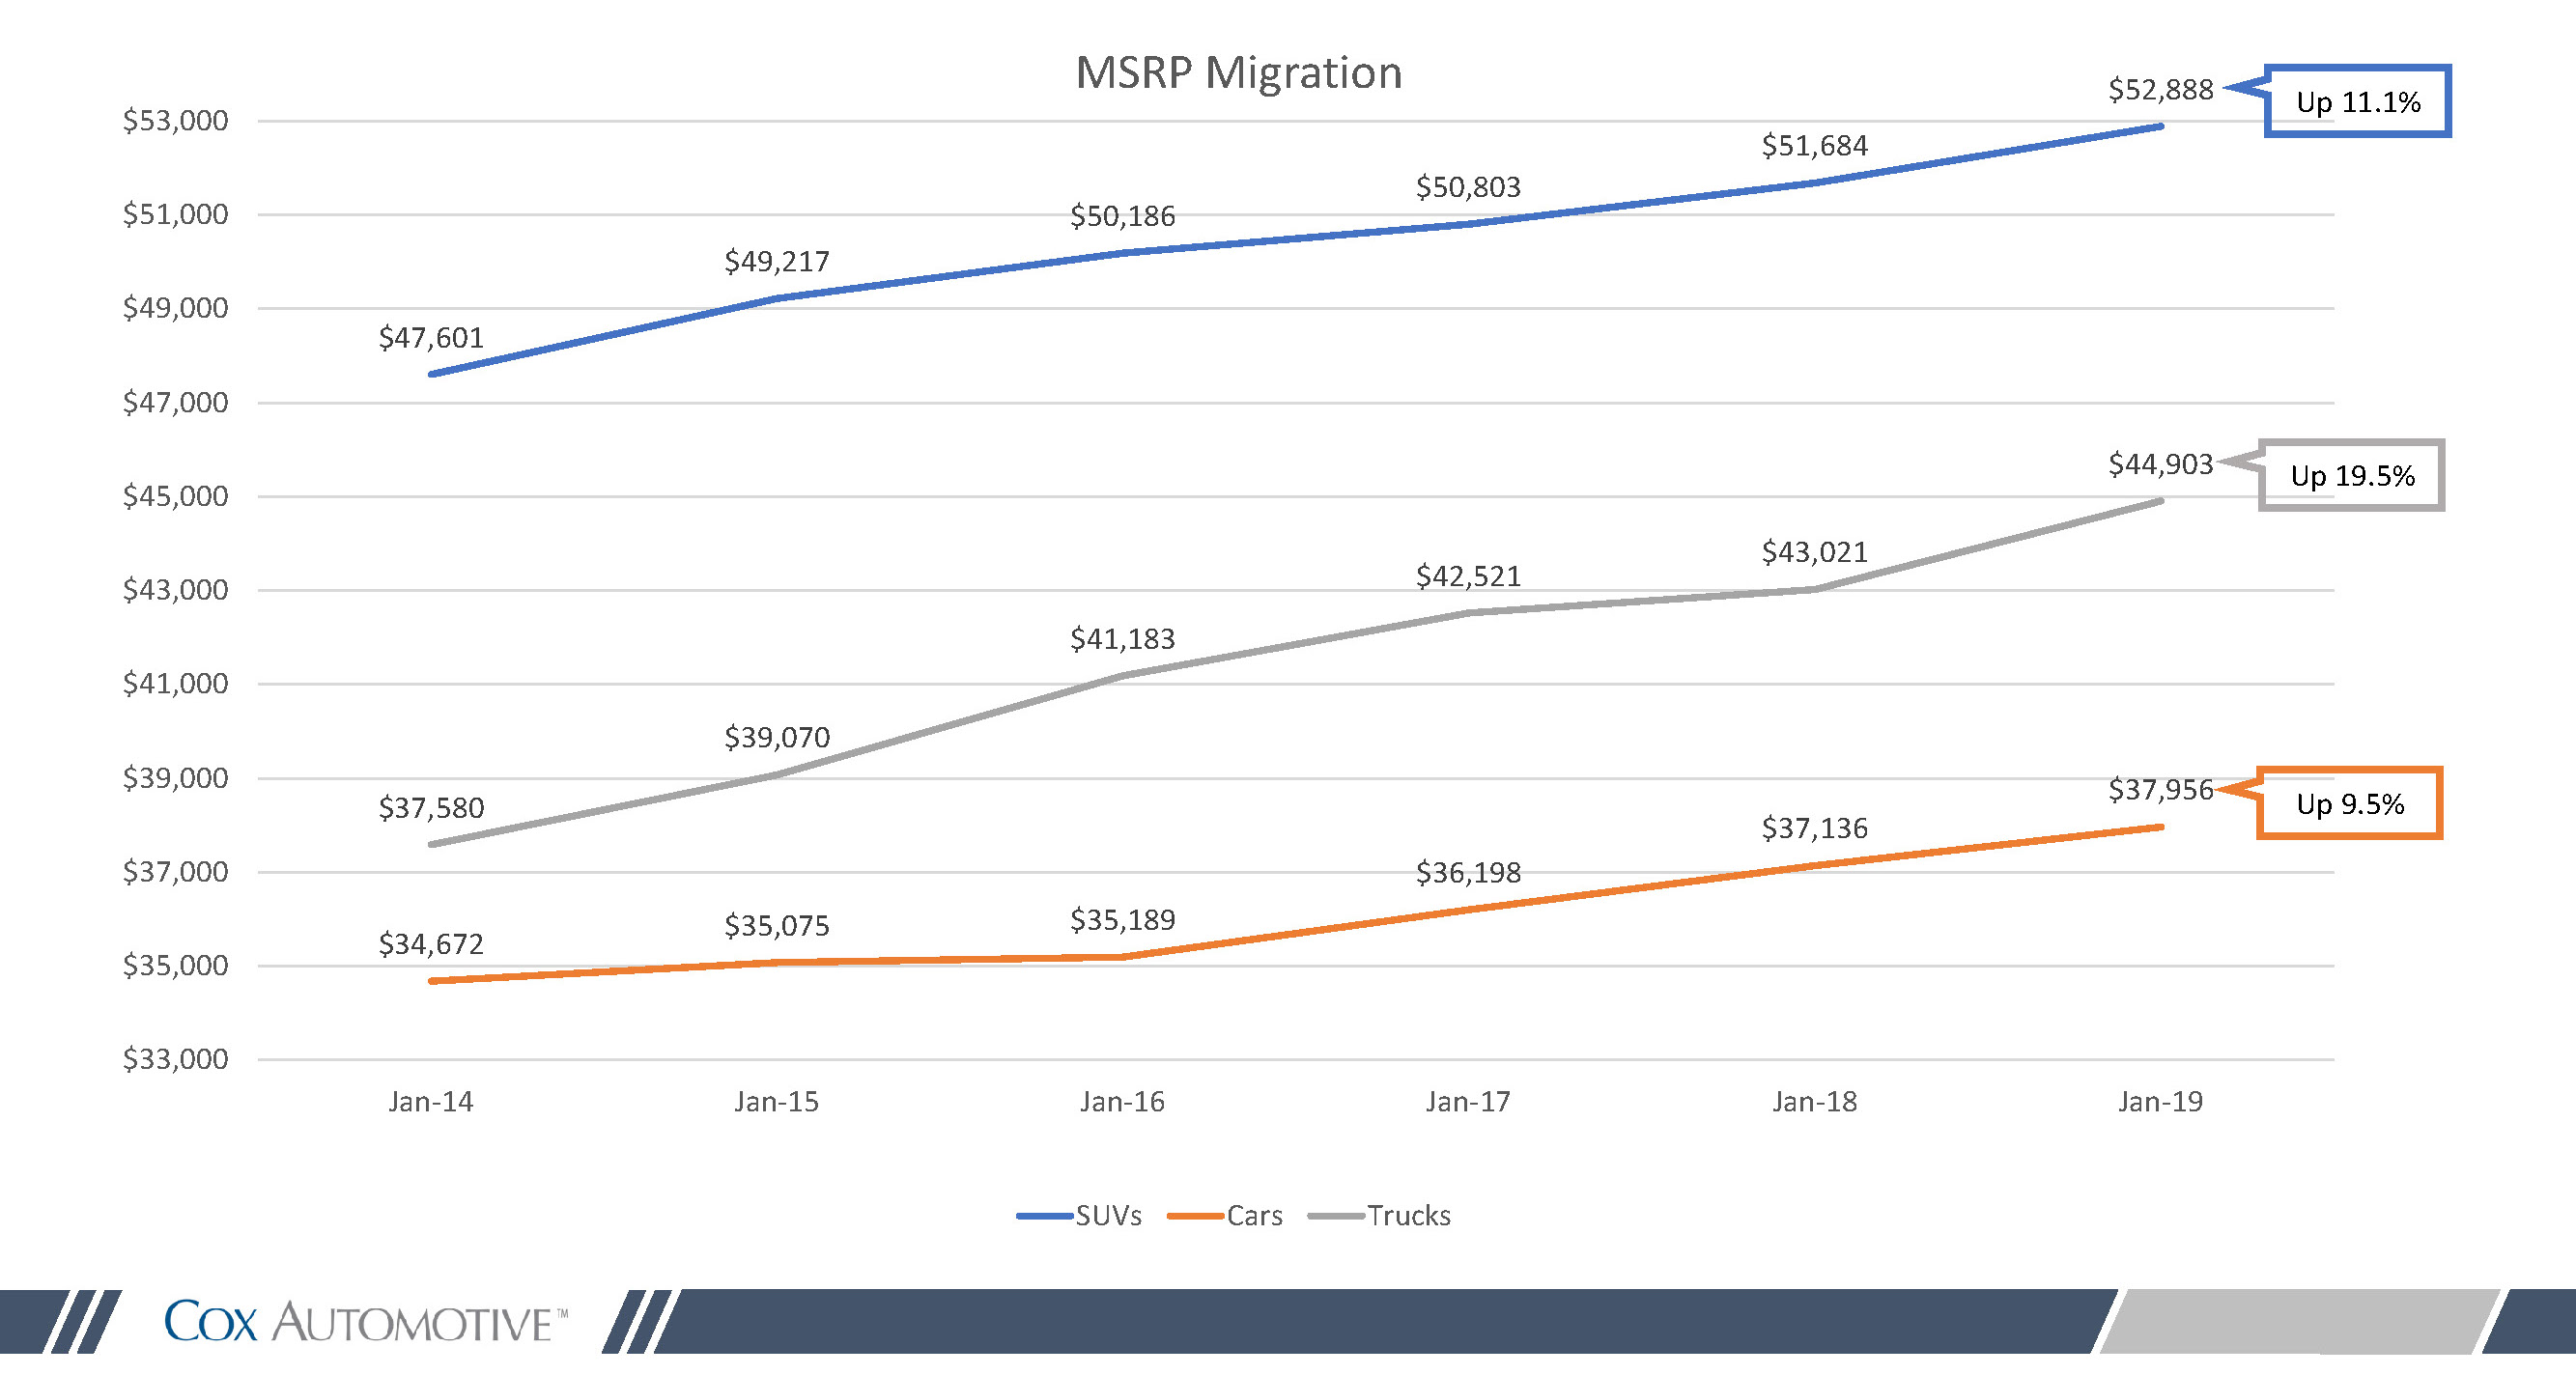
Much of the growth has been driven by segment shifts, with consumers buying more high content SUVs and CUVs and high-end pickup trucks, skewing the numbers upward. Pickup truck prices have moved the most, with MSRPs up nearly 20 percent in 5 years. SUV/CUV MSRPs have risen 11-plus percent, despite the launch of many cheaper, subcompact models. Car prices are up as well, but less than 10 percent in 5 years.
A recent analysis by Cox Automotive illustrates the upward trend. In 2012, 54 percent of new vehicles were priced under $30,000. That number dropped to 36 percent in 2018. Meanwhile, the number of vehicles priced over $50,000 jumped nearly fourfold, from 6 percent in 2012 to 23 percent last year.
It comes as no surprise then that, according Cox Automotive’s 2018 Future of Mobility Study, 48 percent of consumers feel owning or leasing a vehicle is becoming too expensive, up from 42 percent in 2015. The average MSRP of all vehicles sold in the U.S. has increased 15.1 percent in the past five years (Jan 2014 – Jan 2019), a steady uphill battle for vehicle buyers. Peak MSRP months are usually November and December, when a high percentage of luxury vehicles typically sell, bending the average even further upward.