
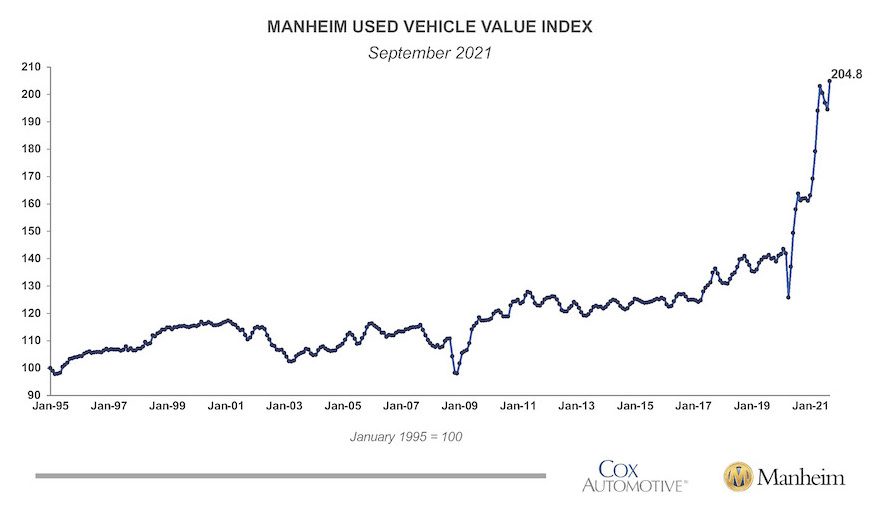
Wholesale used vehicle prices (on a mix-, mileage-, and seasonally adjusted basis) increased 5.3% month-over-month in September. This brought the Manheim Used Vehicle Value Index to 204.8, a 27.1% increase from a year ago.
MANHEIM USED VEHICLE VALUE INDEX
September 2021
Manheim Market Report (MMR) values saw accelerating weekly increases throughout September. Over the full four weeks in the month, the Three-Year-Old Index increased a net 4.6%. Over the month of September, MMR Retention, which is the average difference in price relative to current MMR, averaged 100.8, which meant that market prices were ahead of MMR values. The sales conversion rate also increased over the course of the month and resulted in a much higher average conversion rate of 65% than is typical for September. For example, September 2019 had an average conversion rate of 52%. This indicates that buyers were more aggressive throughout the month.
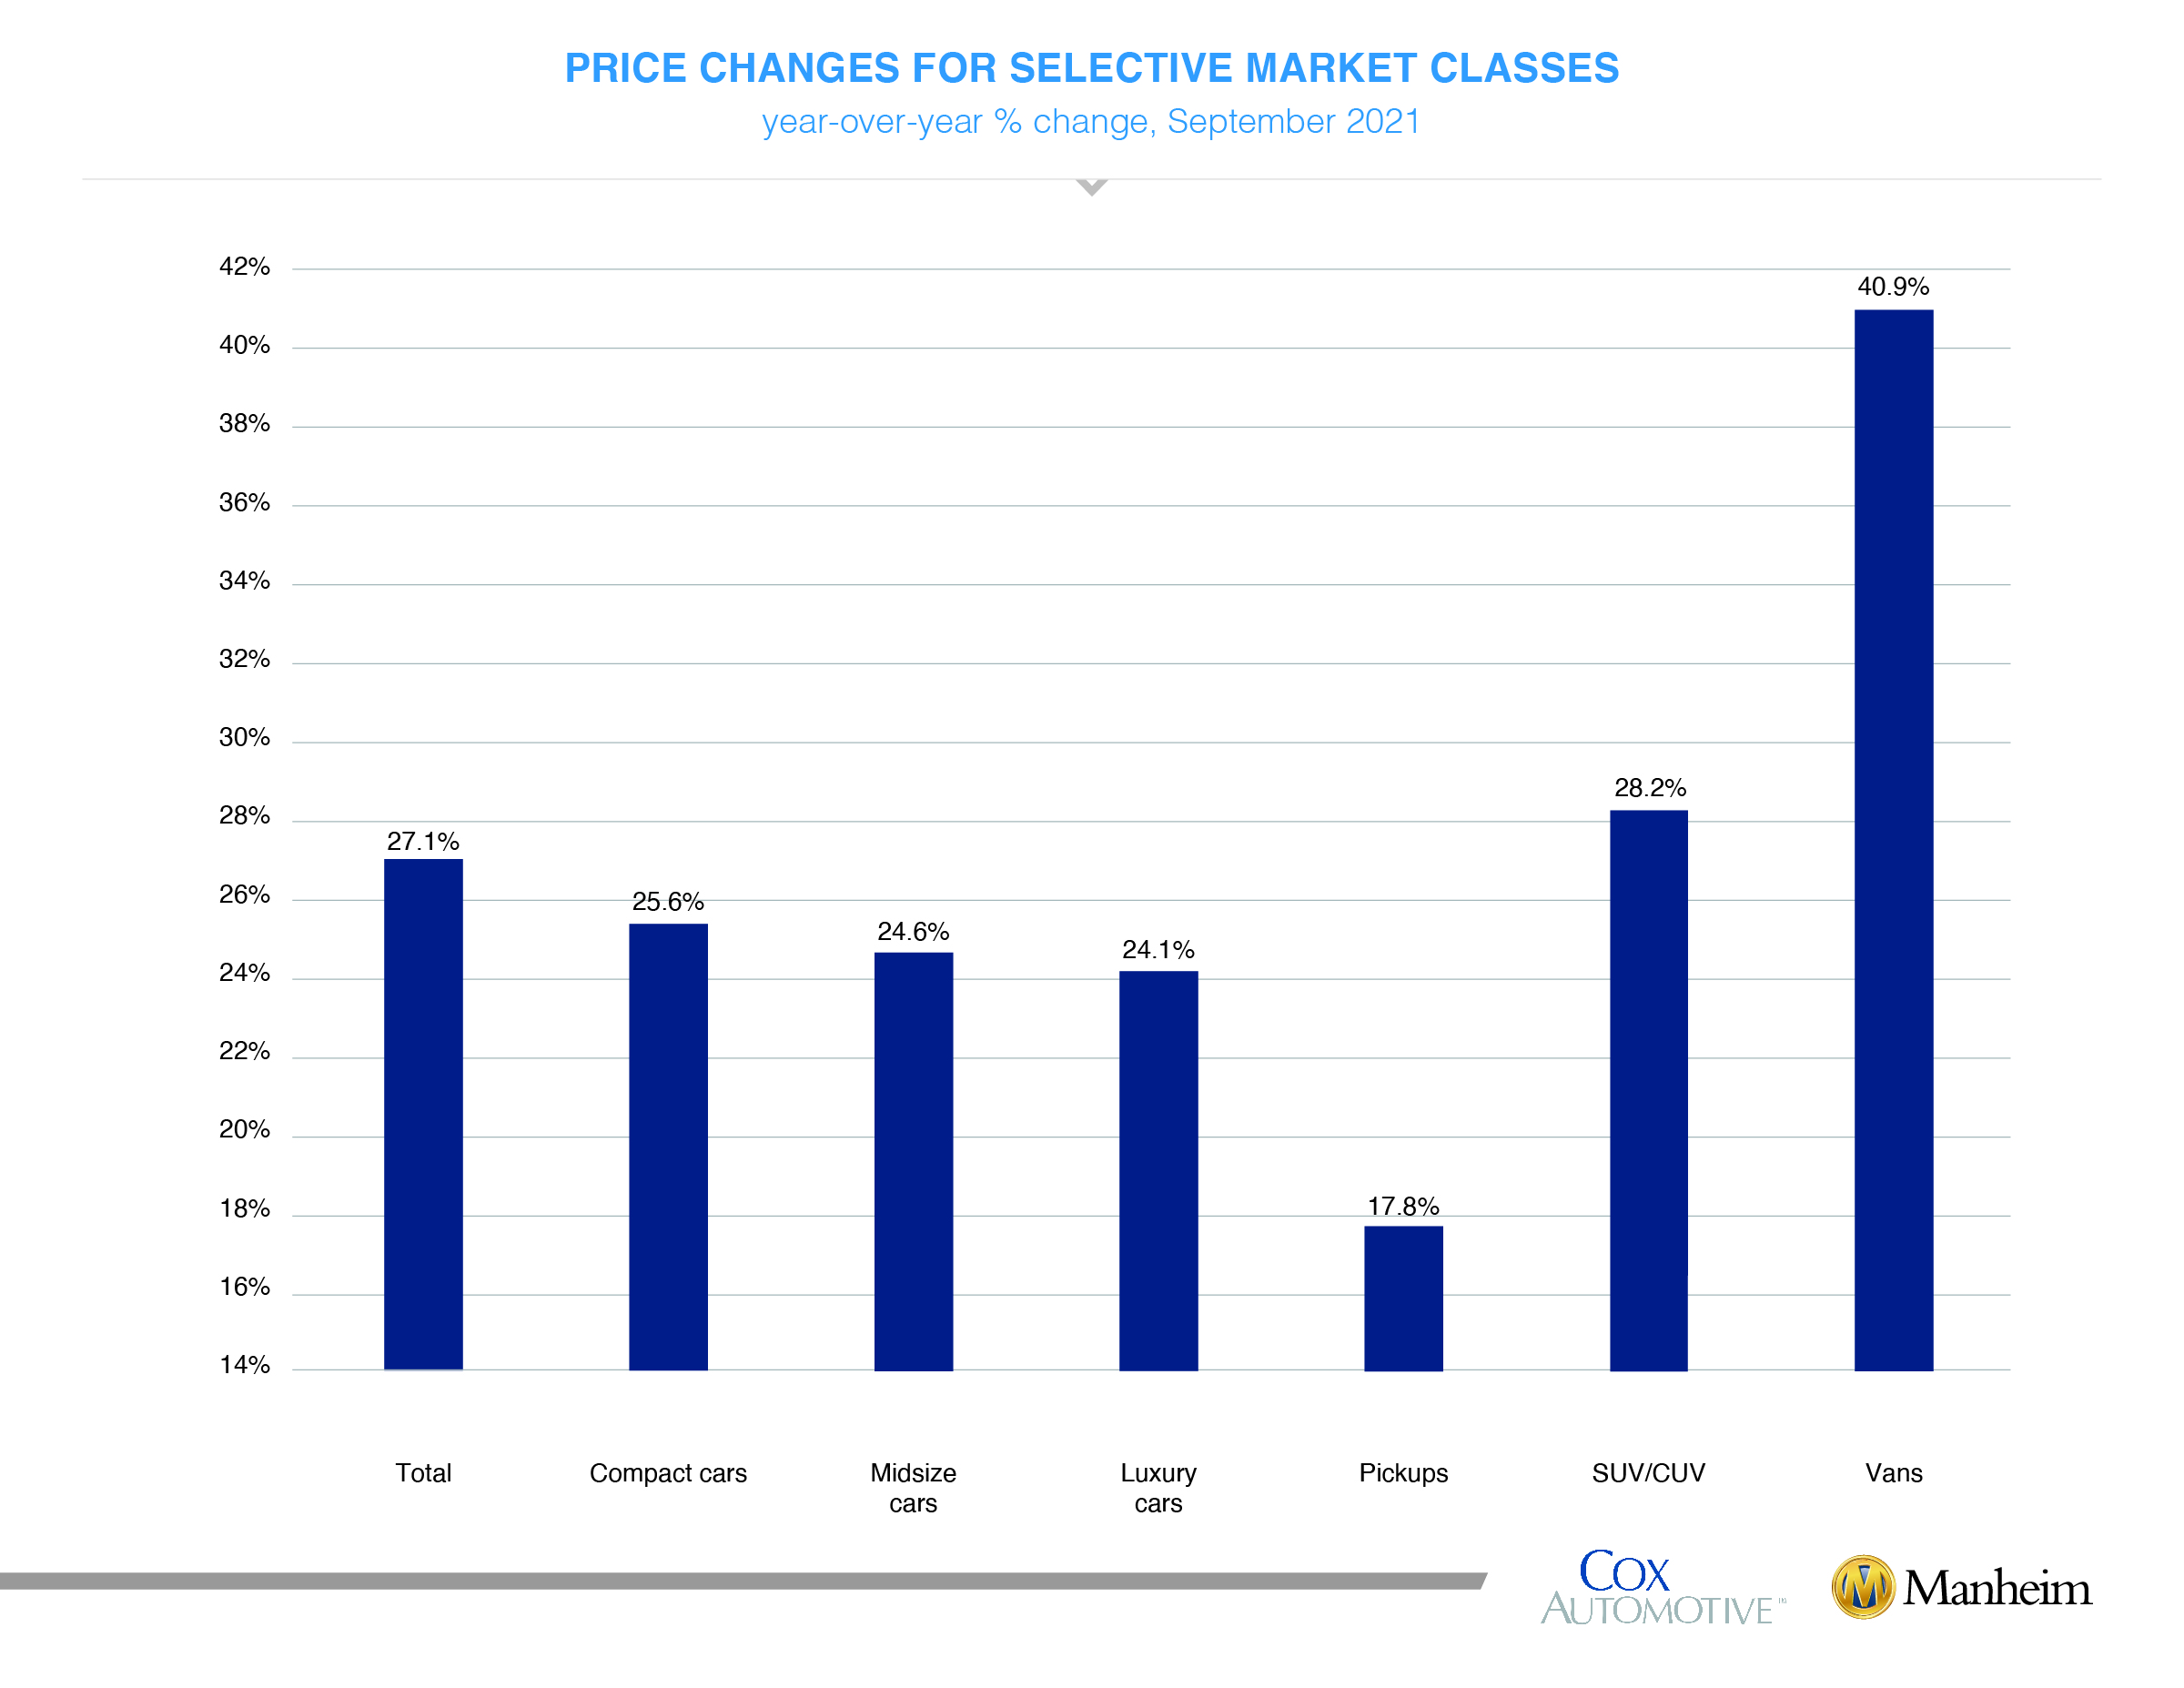
On a year-over-year basis, all major market segments saw seasonally adjusted price increases in September. Vans and sport utility vehicles had the largest year-over-year performance, while the remaining car and pickup segments lagged the overall market. On a month-over-month basis, no segment saw declines.
Price Changes for Selective Market Classes
year-over-year % change, September 2021
Vehicle sales continue to fall. According to Cox Automotive estimates, total used vehicle sales were down 13% year-over-year in September. We estimate the September used SAAR to be 36 million, down from 40.9 million last September and down compared to August’s 36.5 million SAAR. The September used retail SAAR estimate is 19.5 million, down from 21.7 million last year and flat month-over-month.
Using a rolling seven-day estimate of used retail days’ supply based on vAuto data, we see that used retail supply peaked at 114 days on April 8, 2020. Normal used retail supply is about 44 days’ supply. It ended September at 37 days, which is below normal levels. We estimate that wholesale supply peaked at 149 days on April 9, 2020, when normal supply is 23. It ended September at 18 days.
September total new-vehicle sales were down 25% year over year, with the same number of selling days compared to September 2020. Month over month, September new-vehicle sales were down 7%. The September SAAR came in at 12.2 million, a decrease from last year’s 16.3 million and September 2019’s 17.2 million rate.
Combined sales into large rental, commercial, and government buyers were down 21% year over year in September. Sales into rental decreased 17% year over year in September and are up 6% compared to the same time period last year. Commercial sales are down 18% year over year in September and are up 13% year-to-date 2021 versus 2020. Including an estimate for fleet deliveries into the dealer and manufacturer channel, we estimate that the remaining retail sales were down 23% year over year in September, leading to an estimated retail SAAR of 10.7 million, which was down from 14.0 million last September and down from September 2019’s 13.8 million rate.
Rental risk mileage decreasing. The average price for rental risk units sold at auction in September was up 37% year-over-year. Rental risk prices were up 12% compared to August. Average mileage for rental risk units in August (at 56,600 miles) was up 33% compared to a year ago but down 19% month-over-month.
September brings clear declines in consumer sentiment. Consumer Confidence according to the Conference Board declined 5.1% in September and left confidence down 17.6% compared to February 2020. Confidence has declined for three straight months. Plans to purchase a vehicle in the next six months declined to the lowest level in eight months and was much lower than a year ago. Plans to purchase a home also declined to the lowest level in three months and was also down year-over-year. The sentiment index from the University of Michigan reported a 2.5% gain in September. However, the index of consumer sentiment from Morning Consult, which includes data for the full month, showed declines all summer including into September. The Morning Consult index declined 5.5% in July, another 3.1% in August, and ended September down another 0.8%. That left sentiment where we were in early February and down 20.2% from Feb. 29, 2020.
Register now for the Q3 Manheim Used Vehicle Value Index call which will be held on Thursday, Oct. 7, at 11 a.m. EDT.
The complete suite of monthly MUVVI data for October will be released on Friday, Nov. 5, 2021, the fifth business day of the month as regularly scheduled. If you have any questions regarding the Index, please contact the Cox Automotive Industry Insights team at Manheim.Data@coxautoinc.com.


