Commentary & Voices
Spring Bounce Fading, But Tariffs May Provide Support
Friday June 7, 2019
Article Highlights
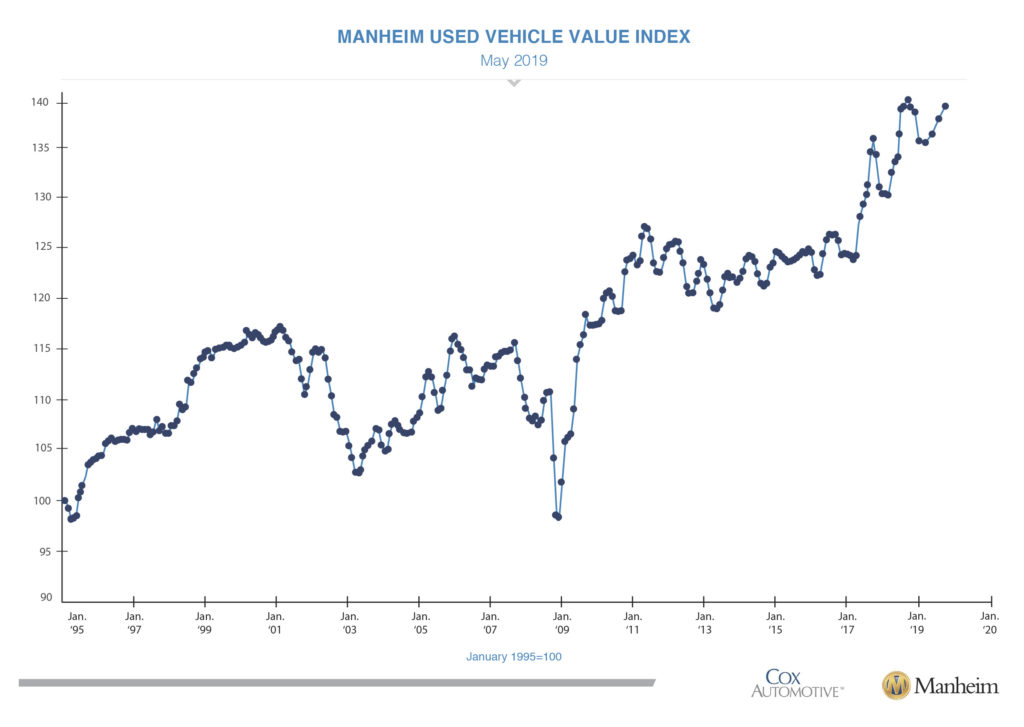
- The May Manheim Used Vehicle Value Index is 139.6, a 4.0% increase from a year ago.
- Looking at trends in weekly Manheim Market Report (MMR) prices, the spring bounce in values ended in April, and May saw steady and slightly lower than normal depreciation each week.
- New tariffs on all goods from Mexico poised to start June 10 could lead to stronger than normal summer sales in the weeks ahead as consumers attempt to head off higher prices.
Wholesale used vehicle prices (on a mix-, mileage-, and seasonally adjusted basis) increased 0.85% month-over-month in May. This brought the Manheim Used Vehicle Value Index to 139.6, a 4.0% increase from a year ago. Looking at trends in weekly Manheim Market Report (MMR) prices, the spring bounce in values ended in April, and May saw steady and slightly lower than normal depreciation each week. Three-year-old vehicle values in aggregate saw a decline of 1.3% for the month, which matched last year’s performance. Prices in aggregate are now lower than the beginning of the year, but non-luxury prices remain higher as a result of their strong spring bounce. Luxury vehicle prices, which have seen abnormally high depreciation this year, saw declining depreciation in May.
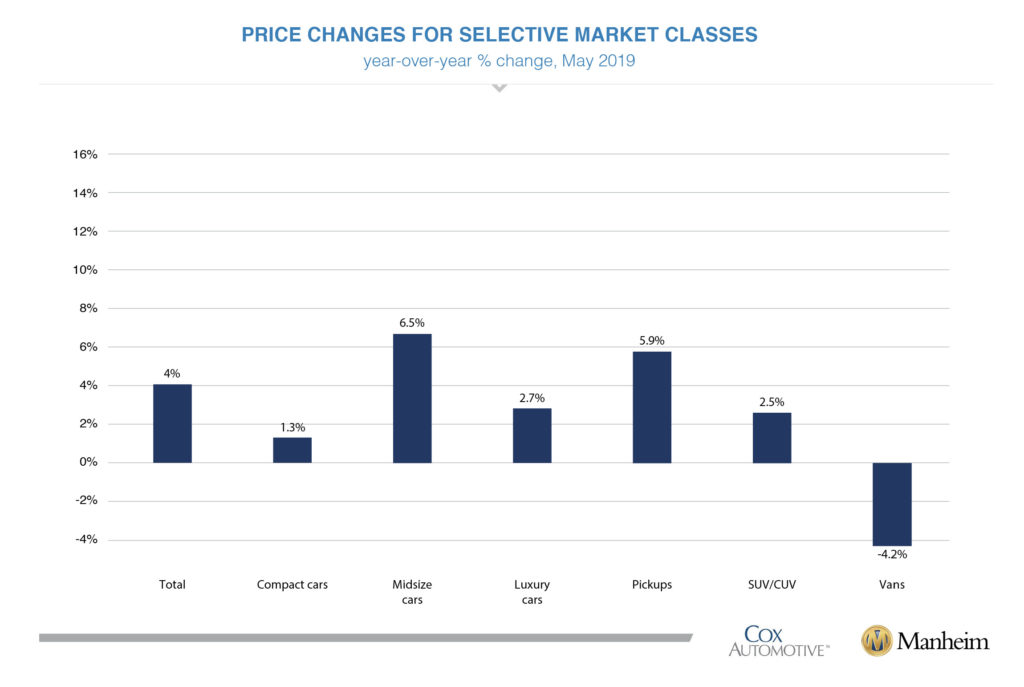
On a year-over-year basis, most major market segments saw seasonally adjusted price gains in May. Midsize cars and pickups outperformed the overall market, while all other major segments underperformed the overall market.
Weak retail results for vehicle sales in May. According to Cox Automotive estimates, used-vehicle sales volume was down 4.0% year over year in May. We estimate the May used SAAR to be 39.2 million, down from 39.7 million last May and down slightly from April’s 39.3 million rate.
Like the used market, the new-vehicle market showed weakness in May. May new-vehicle sales were down 0.5% year-over-year, with the same number of selling days as May 2018. The May SAAR came in at 17.3 million, improving versus last year’s 17.2 million and April’s 16.3 million rate. Cars continue to see declines, as sales in May fell 12% compared to last year. Light trucks outperformed cars in May, finishing the month up 5% year-over-year.
Combined rental, commercial, and government purchases of new vehicles were up 11% year-over-year in May, and up 29% month-over-month. Commercial (+12%) and rental (+14%) fleet channels were up year-over-year in May. New-vehicle retail sales were down 3% in May, leading to a retail SAAR of 13.9 million, down from 14.2 million last May.
New-vehicle inventories came in under 4 million units for the first time in four months.
Rental risk pricing improves. The average price for rental risk units sold at auction in May was up 3% year-over-year. Rental risk prices were down 0.1% compared to April. Average mileage for rental risk units in May (at 45,300 miles) was up 5% compared to a year ago and up 1% month-over-month.
Favorable consumer confidence among mixed conditions. The first revision of estimated first quarter real GDP growth came in at 3.1%, which was lower than the first estimate of 3.2%. Consumer spending was estimated slightly higher but still represented weaker growth by increasing only 1.3%. Growth in business investment was revised down to an even weaker 2.3%. Consumer Confidence as measured by The Conference Board increased 3.8% in May. This was the first time this year that confidence has improved in back-to-back months. As a result of the two-month trend improving, the confidence index is at the highest level since November and is now higher than last year. Plans to purchase a vehicle in the next six months also increased in May to a level that is now higher than at any point since the Great Recession. New tariffs on all goods from Mexico poised to start June 10 could lead to stronger than normal summer sales in the weeks ahead as consumers attempt to head off higher prices. Stronger than normal retail sales could push wholesale prices higher again in June, which is the same trend that occurred last year.
The Manheim Used Vehicle Value Index data file is available for download here.
