Commentary & Voices
Strong July Looks Weak Compared to Last Year
Wednesday August 7, 2019
Article Highlights
- The Manheim Used Vehicle Value Index for July is 140.5, a 2.6% increase from a year ago.
- On a year-over-year basis, most major market segments saw weak seasonally adjusted price gains in July.
- According to Cox Automotive estimates, total used vehicle sales volume was down 0.3% year-over-year in July. We estimate the July used SAAR to be 39.7 million, down from 40.1 million last July and down slightly from June’s 39.8 million rate.
Wholesale used vehicle prices (on a mix-, mileage-, and seasonally adjusted basis) increased 0.01% month-over-month in July. This brought the Manheim Used Vehicle Value Index to 140.5, a 2.6% increase from a year ago.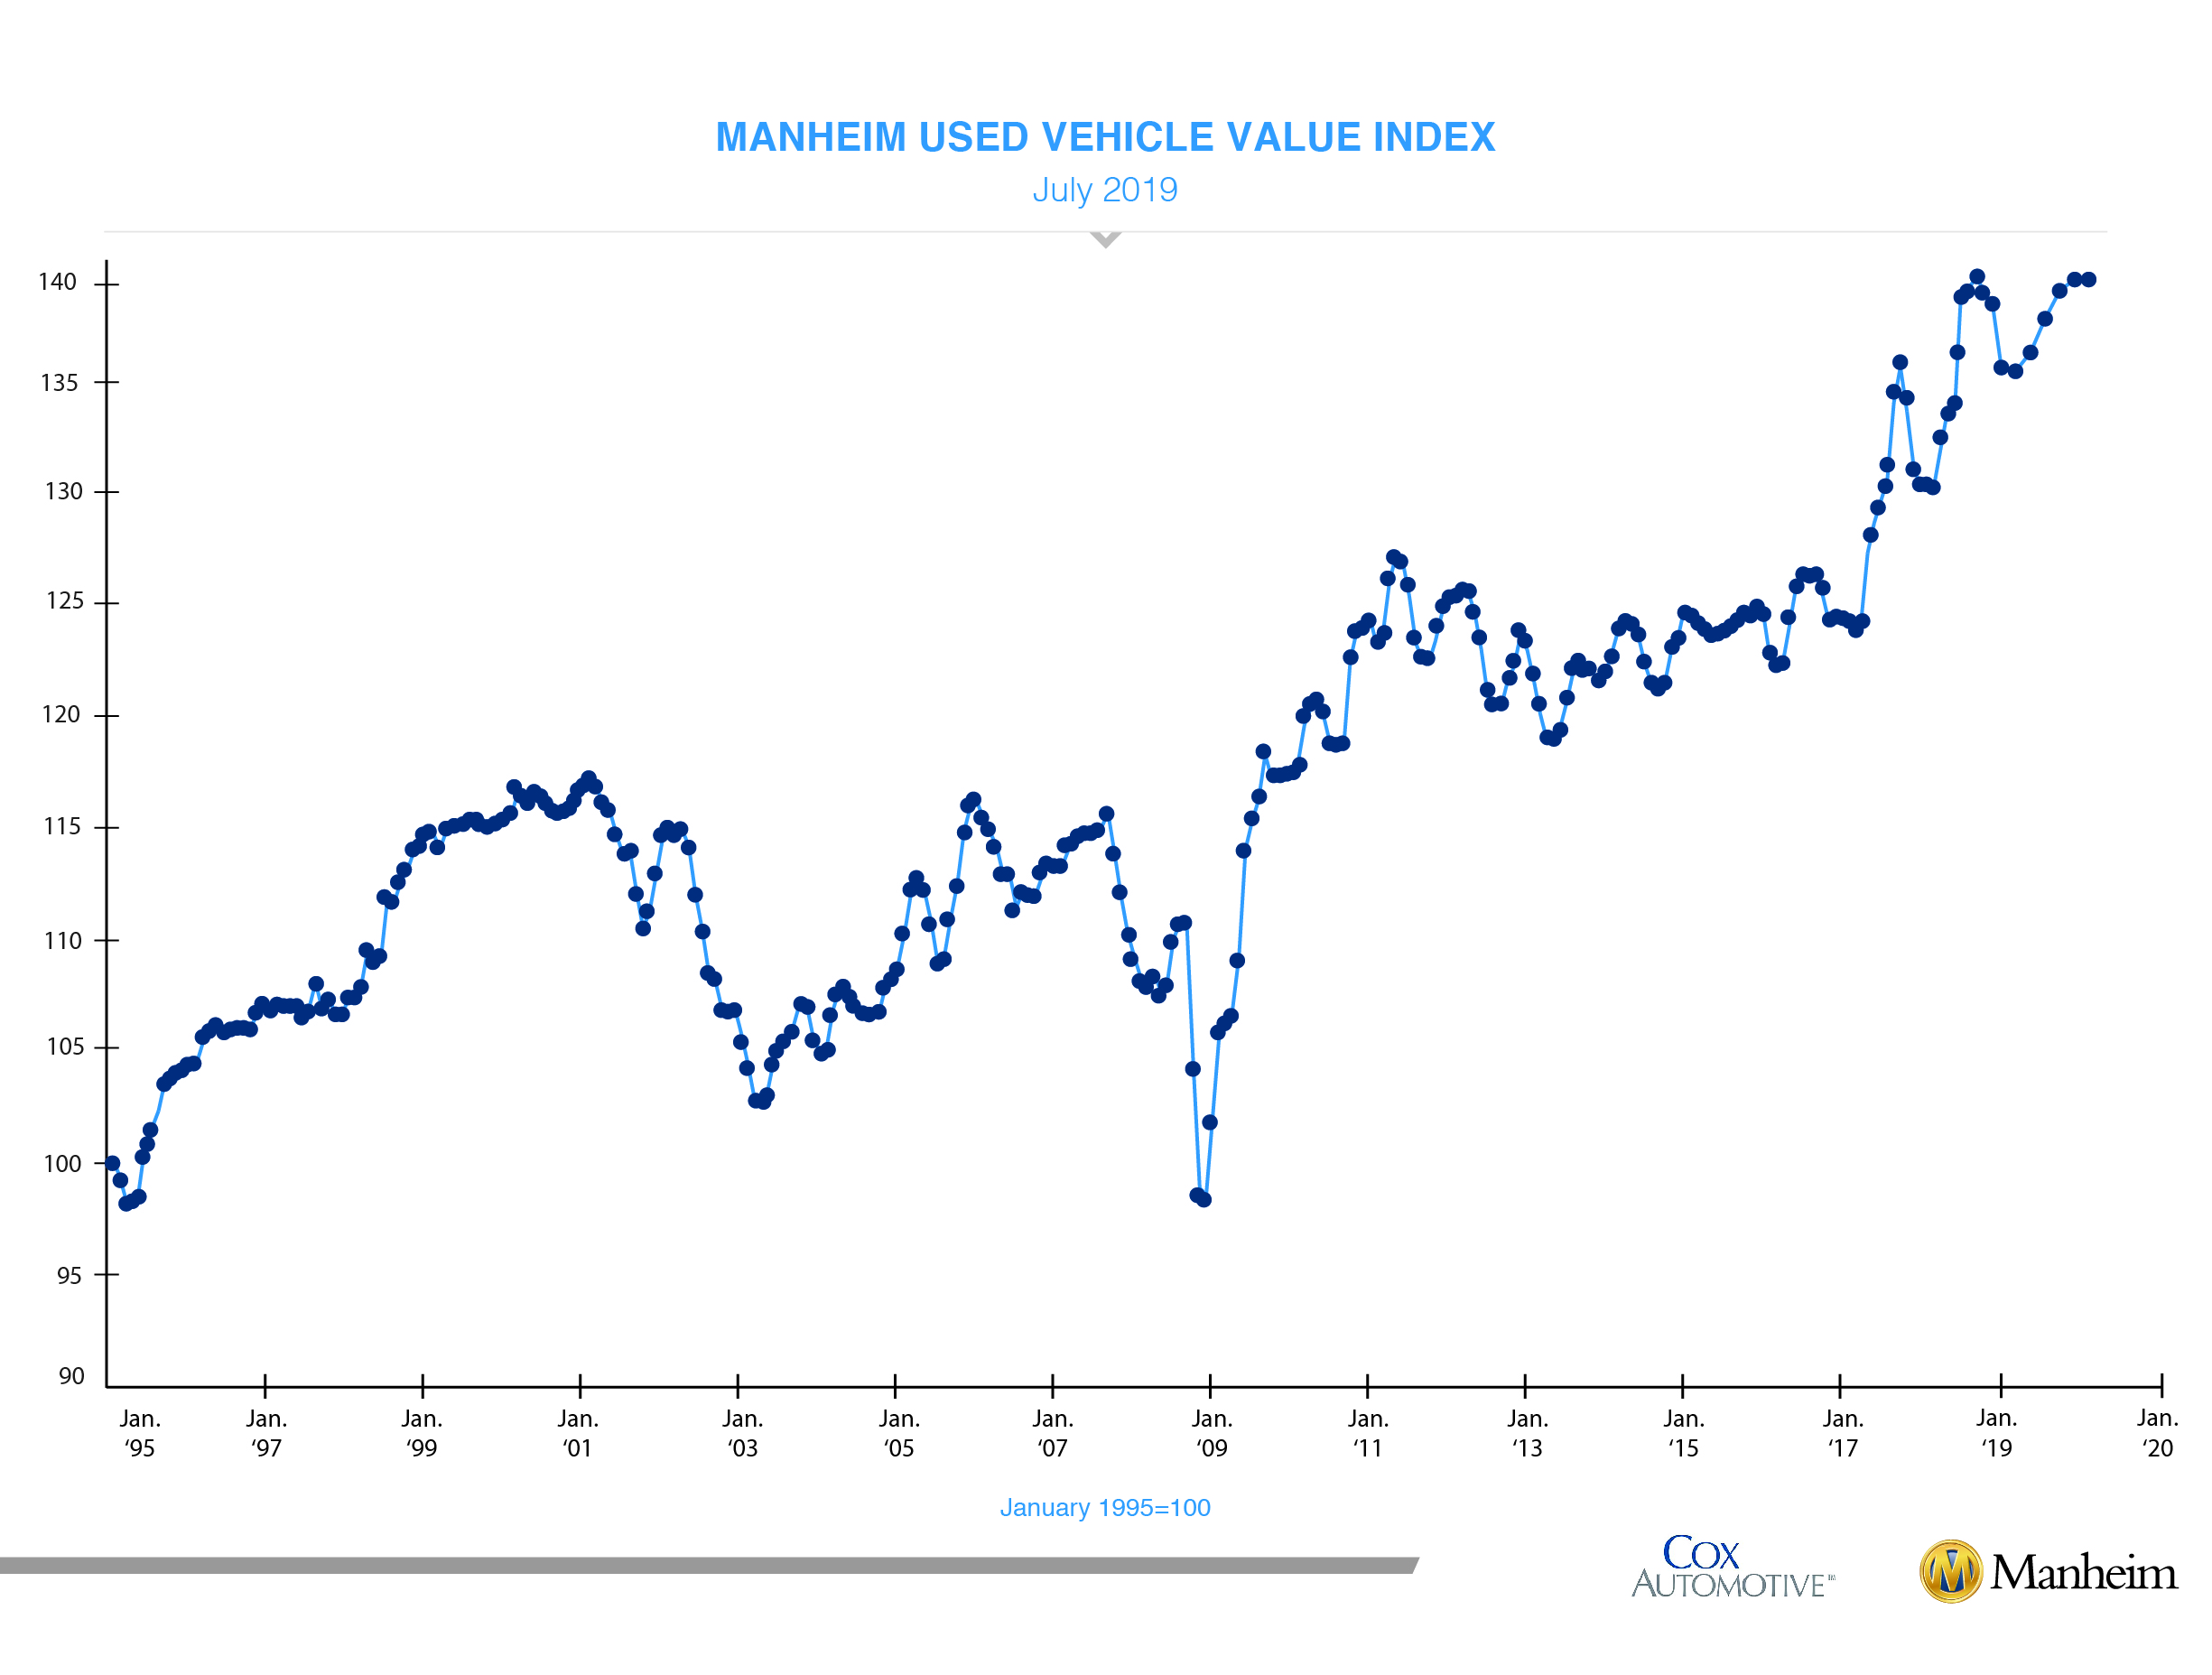
After seeing steady to slightly higher prices in June in weekly Manheim Market Report (MMR) prices, July prices were firm. Three-year-old vehicle values in aggregate were flat for the month, which is much stronger than a typical July, when prices normally decline by about 1%. As a result of the stable month, prices in aggregate remain slightly lower than the beginning of the year, but non-luxury prices remain higher. Last July saw price appreciation, so even with stable prices, the comparison to last year is particularly tough.
On a year-over-year basis, most major market segments saw weak seasonally adjusted price gains in July. Vans and pickups outperformed the overall market, while most other major segments underperformed the overall market. Last year is a tough comparison for both prices and sales as we experienced an abnormal increase in consumer demand during the summer driven by tariff fears and rising interest rates.

Mixed retail results for vehicle sales year-over-year. According to Cox Automotive estimates, total used vehicle sales volume was down 0.3% year-over-year in July. We estimate the July used SAAR to be 39.7 million, down from 40.1 million last July and down slightly from June’s 39.8 million rate. The July used retail SAAR estimate is 20.1 million, up from 19.8 million last July and up from June’s 19.8 million rate.
The retail new-vehicle market was also soft in July. July total new vehicle sales were up 2.1% year-over-year, with one more selling day compared to July 2018. The July SAAR came in at 16.8 million, declining versus last year’s 16.9 million and down slightly from June’s 17.1 million rate. Cars continue to see declines, as sales in July fell 9% compared to last year. Market share for cars was 27% last month. Light trucks outperformed cars in July, finishing the month up 7% year-over-year.
Strong fleet sales continue to support the new-vehicle market. Combined rental, commercial, and government purchases of new vehicles were up 8% year-over-year in July. The commercial fleet channel was up 30% year-over-year in July. With the highest average incentive in 19 months, retail sales of new vehicles were up 1.4% in July, leading to a retail SAAR of 14.7 million, down from 14.9 million last July but the strongest retail SAAR since December. Fleet sales are up 6% in 2019 through July, and retail sales are down 3% as the overall new vehicle market is down 2% this year.
New vehicle inventories came in under 4 million units for the third consecutive month and are at the lowest level since September 2018.
Rental risk pricing improves. The average price for rental risk units sold at auction in July was up 3% year-over-year. Rental risk prices were up 1% compared to June. Average mileage for rental risk units in July (at 49,000 miles) was up 9% compared to a year ago and up 5% month-over-month.
Slowing job growth among mixed conditions. July saw 164,000 jobs created, which was in line with expectations. The pace of growth slowed from 193,000 jobs created in June. The prior two monthly numbers were revised down for 41,000 net fewer jobs than originally estimated. The headline unemployment rate remained at 3.7%. Consumer confidence jumped 9.2% in July for its highest reading of the year as both the underlying views of the present situation and expectations for the future improved. Plans to purchase an auto in the next six months did not see a corresponding jump. Consumer confidence will likely take a hit in August with escalating trade tensions with China and associated volatility in equity markets.
The Manheim Used Vehicle Value Index data file is available for download.