Commentary & Voices
Toyota Reports Fiscal Q3 Earnings with Flat U.S. Sales and Market Share
Tuesday February 5, 2019
Toyota reports earnings Wednesday for its third-quarter ended Dec. 31, 2018. Toyota’s fiscal year ends March 31, 2019.
| Brand Sales | |||
| Q4-2017 | Q4-2018 | 2018 Change | |
| Lexus | 85,473 | 84,686 | -0.9% |
| Toyota | 517,555 | 517,746 | 0.0% |
| Total | 603,028 | 602,432 | -0.1% |
| Market Share | |||
| Make | Q4-2017 | Q4-2018 | 2018 Change |
| Lexus | 2.0% | 1.9% | 0.0% |
| Toyota | 11.9% | 11.8% | -0.1% |
| Total | 13.9% | 13.7% | -0.2% |
In the U.S., Toyota’s sales and market share for the final quarter of calendar 2018 were flat.

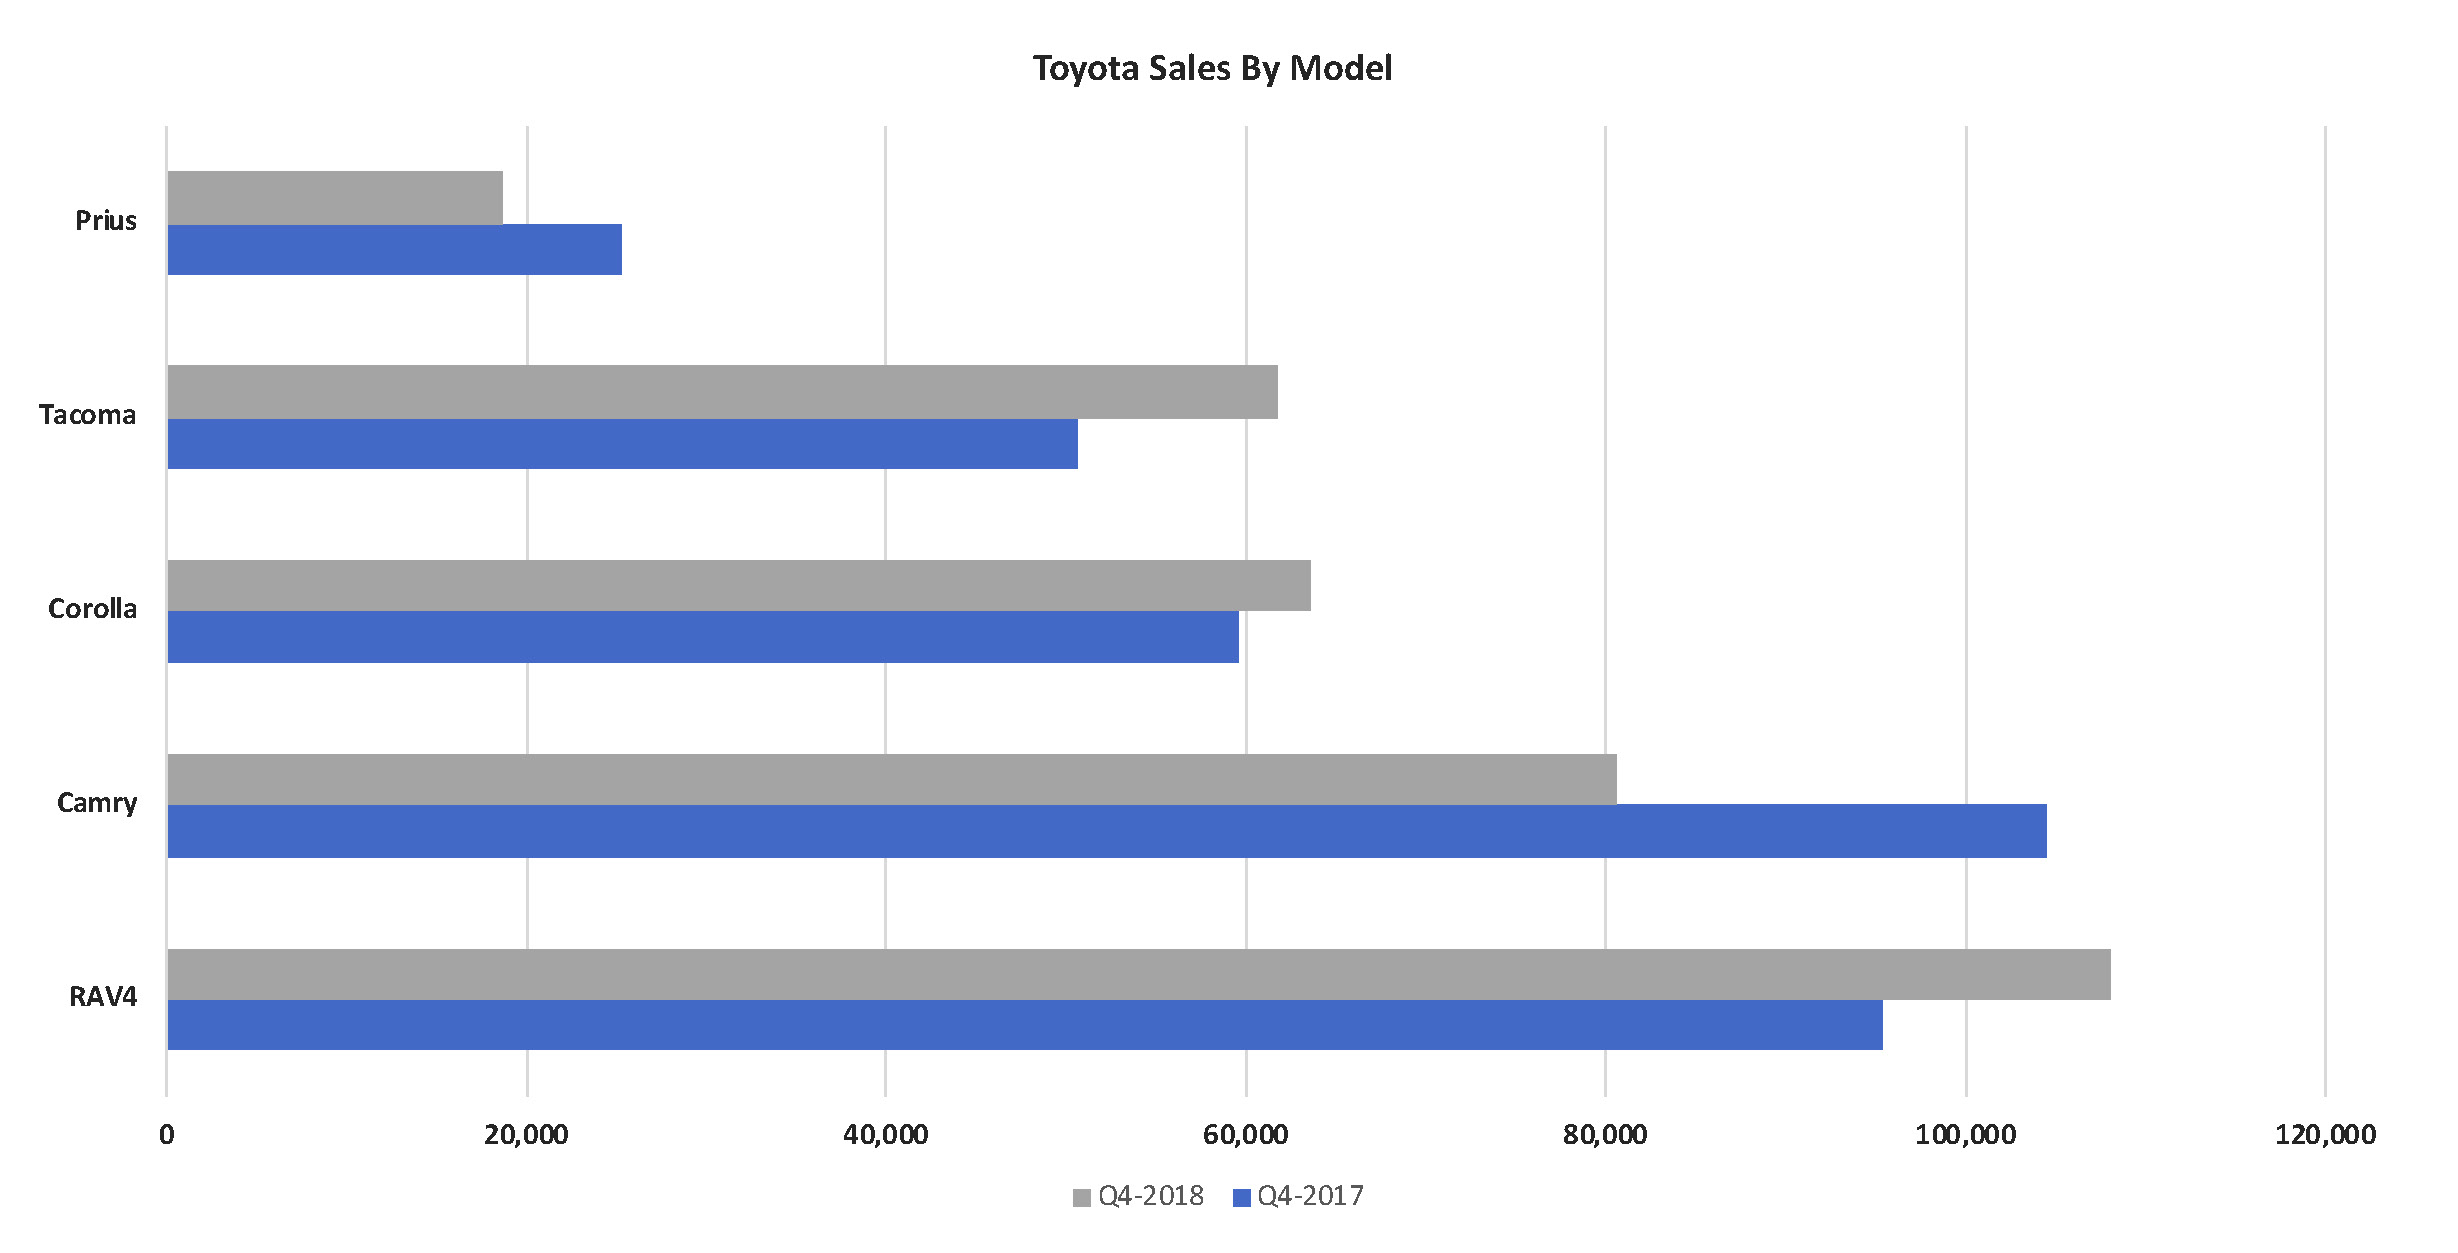
Toyota’s best-selling models illustrate the trend of the overall market – truck and utility-vehicle sales are up while car sales generally are down. The RAV4, now Toyota’s best-selling model in the U.S., posted a 13-percent increase in sales in the quarter. Sales of the midsize Toyota Tacoma pickup, which dominates its segment, were up 22 percent.
Meantime, sales of Toyota’s previous best-selling model, the midsize Camry sedan, were off 23 percent, and the hybrid Prius, once thought of as a brand within the Toyota brand and dominating the hybrid market, were down 26 percent. Only the Corolla subcompact saw a sales gain.

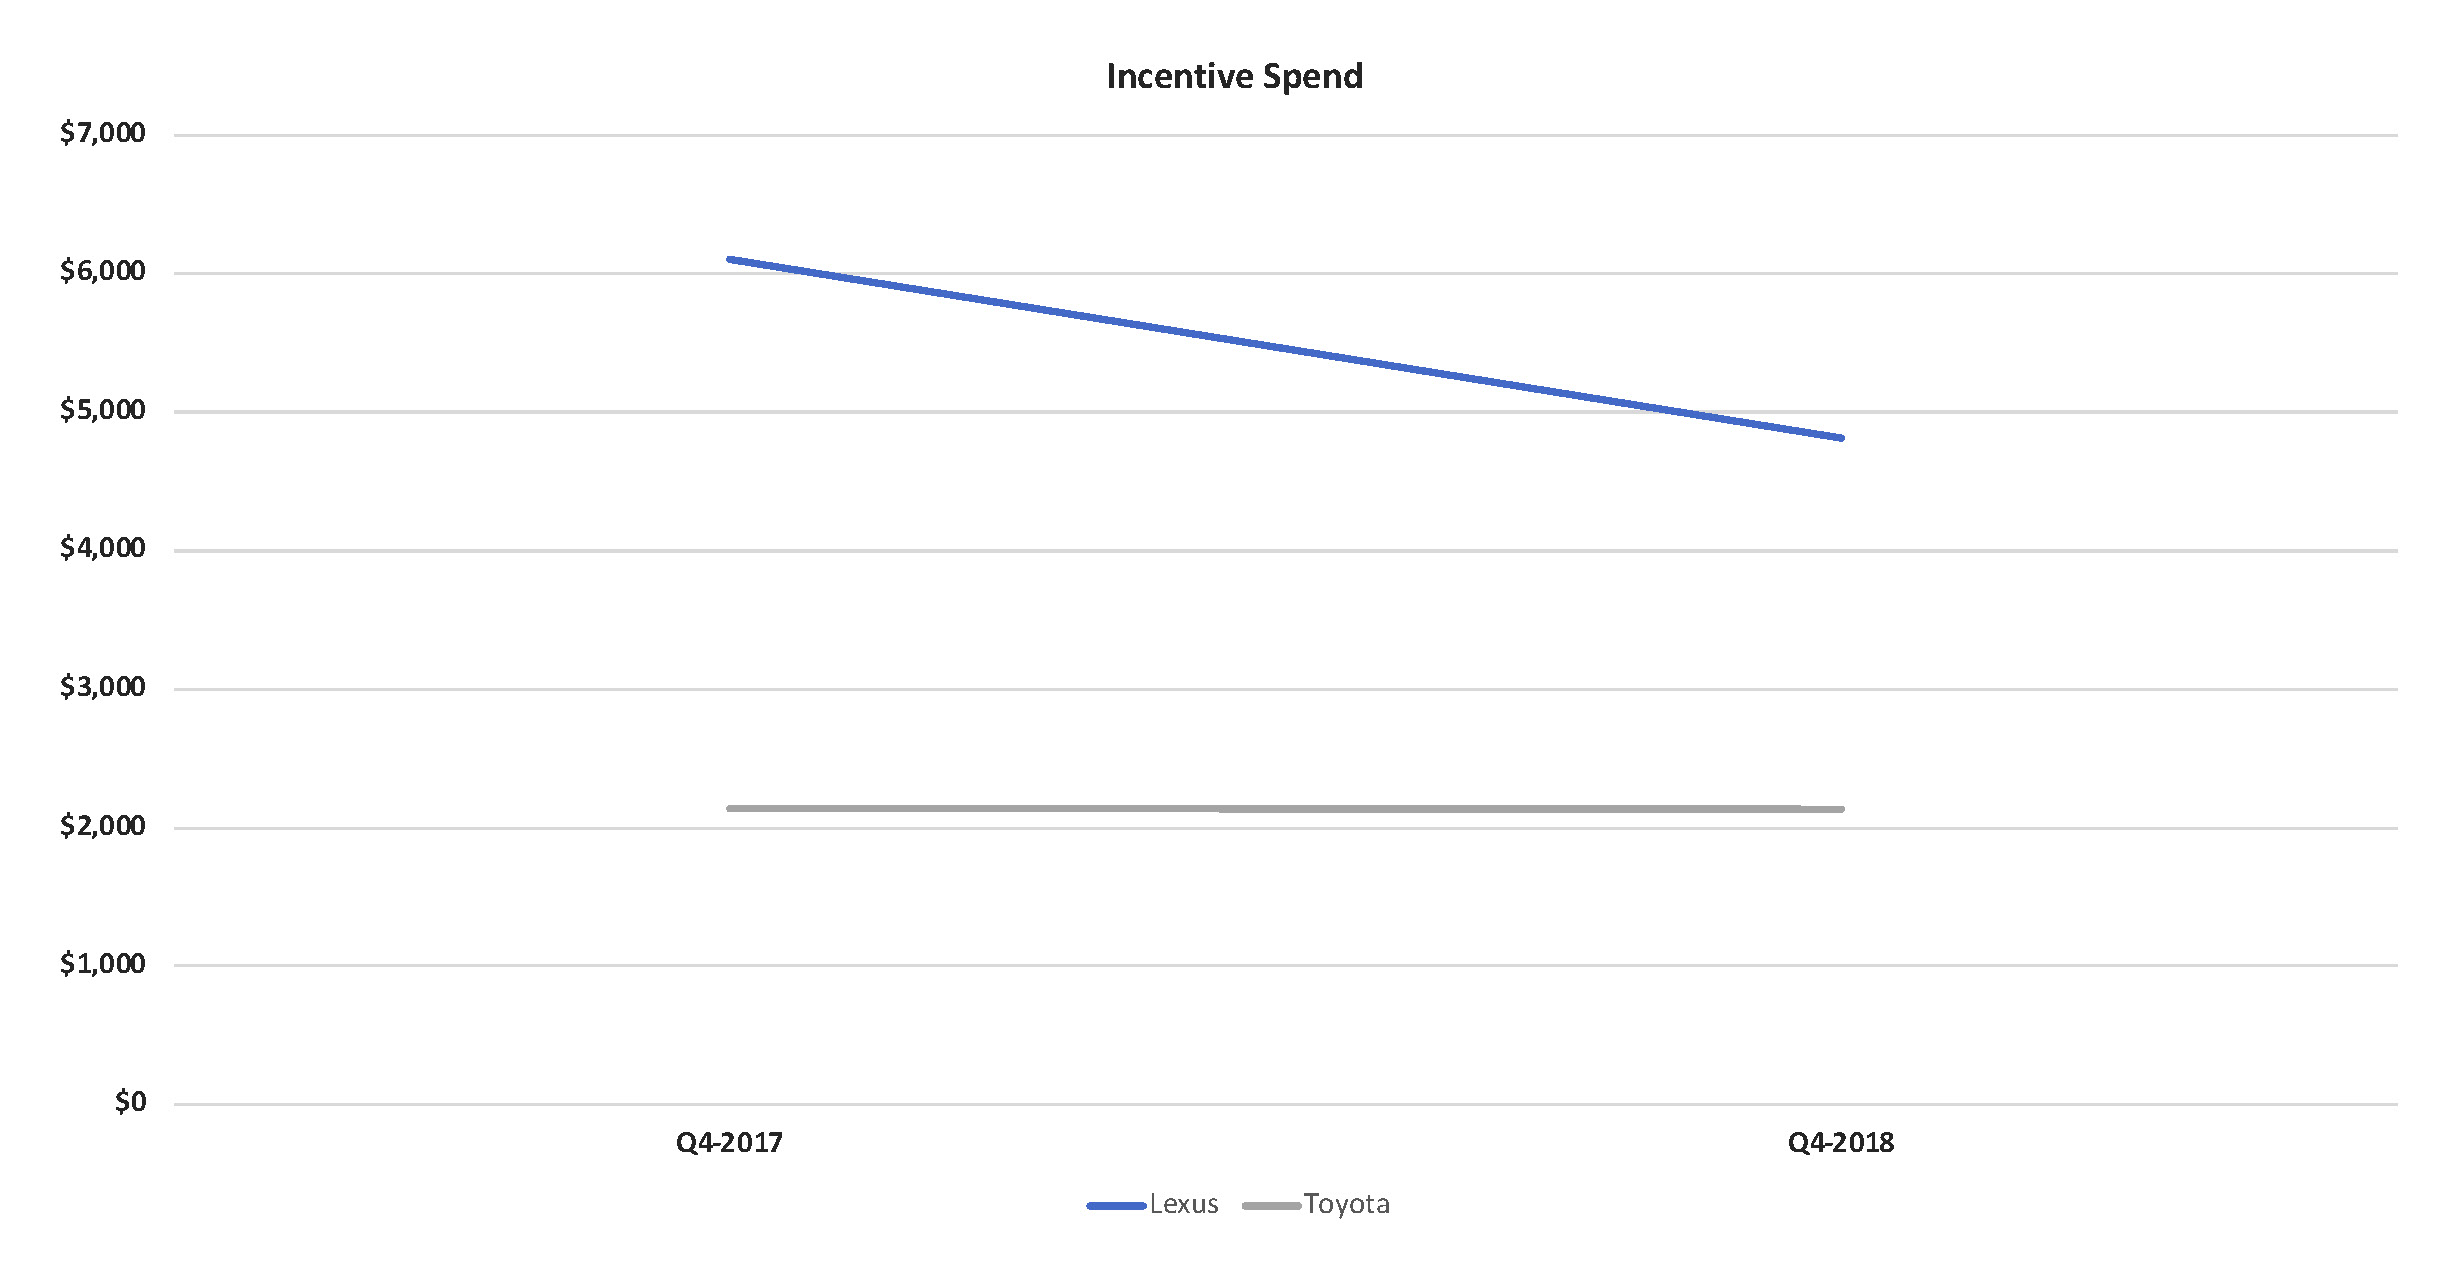
Toyota, which previously did minimal fleet business, ramped up its sales to fleets in 2018. It dialed back incentives in the last quarter from the year earlier, mostly on Lexus. Lexus incentives dropped 21 percent from last year’s extremely high levels. Both Toyota and Lexus incentives remain high relative to Toyota’s historic pattern.

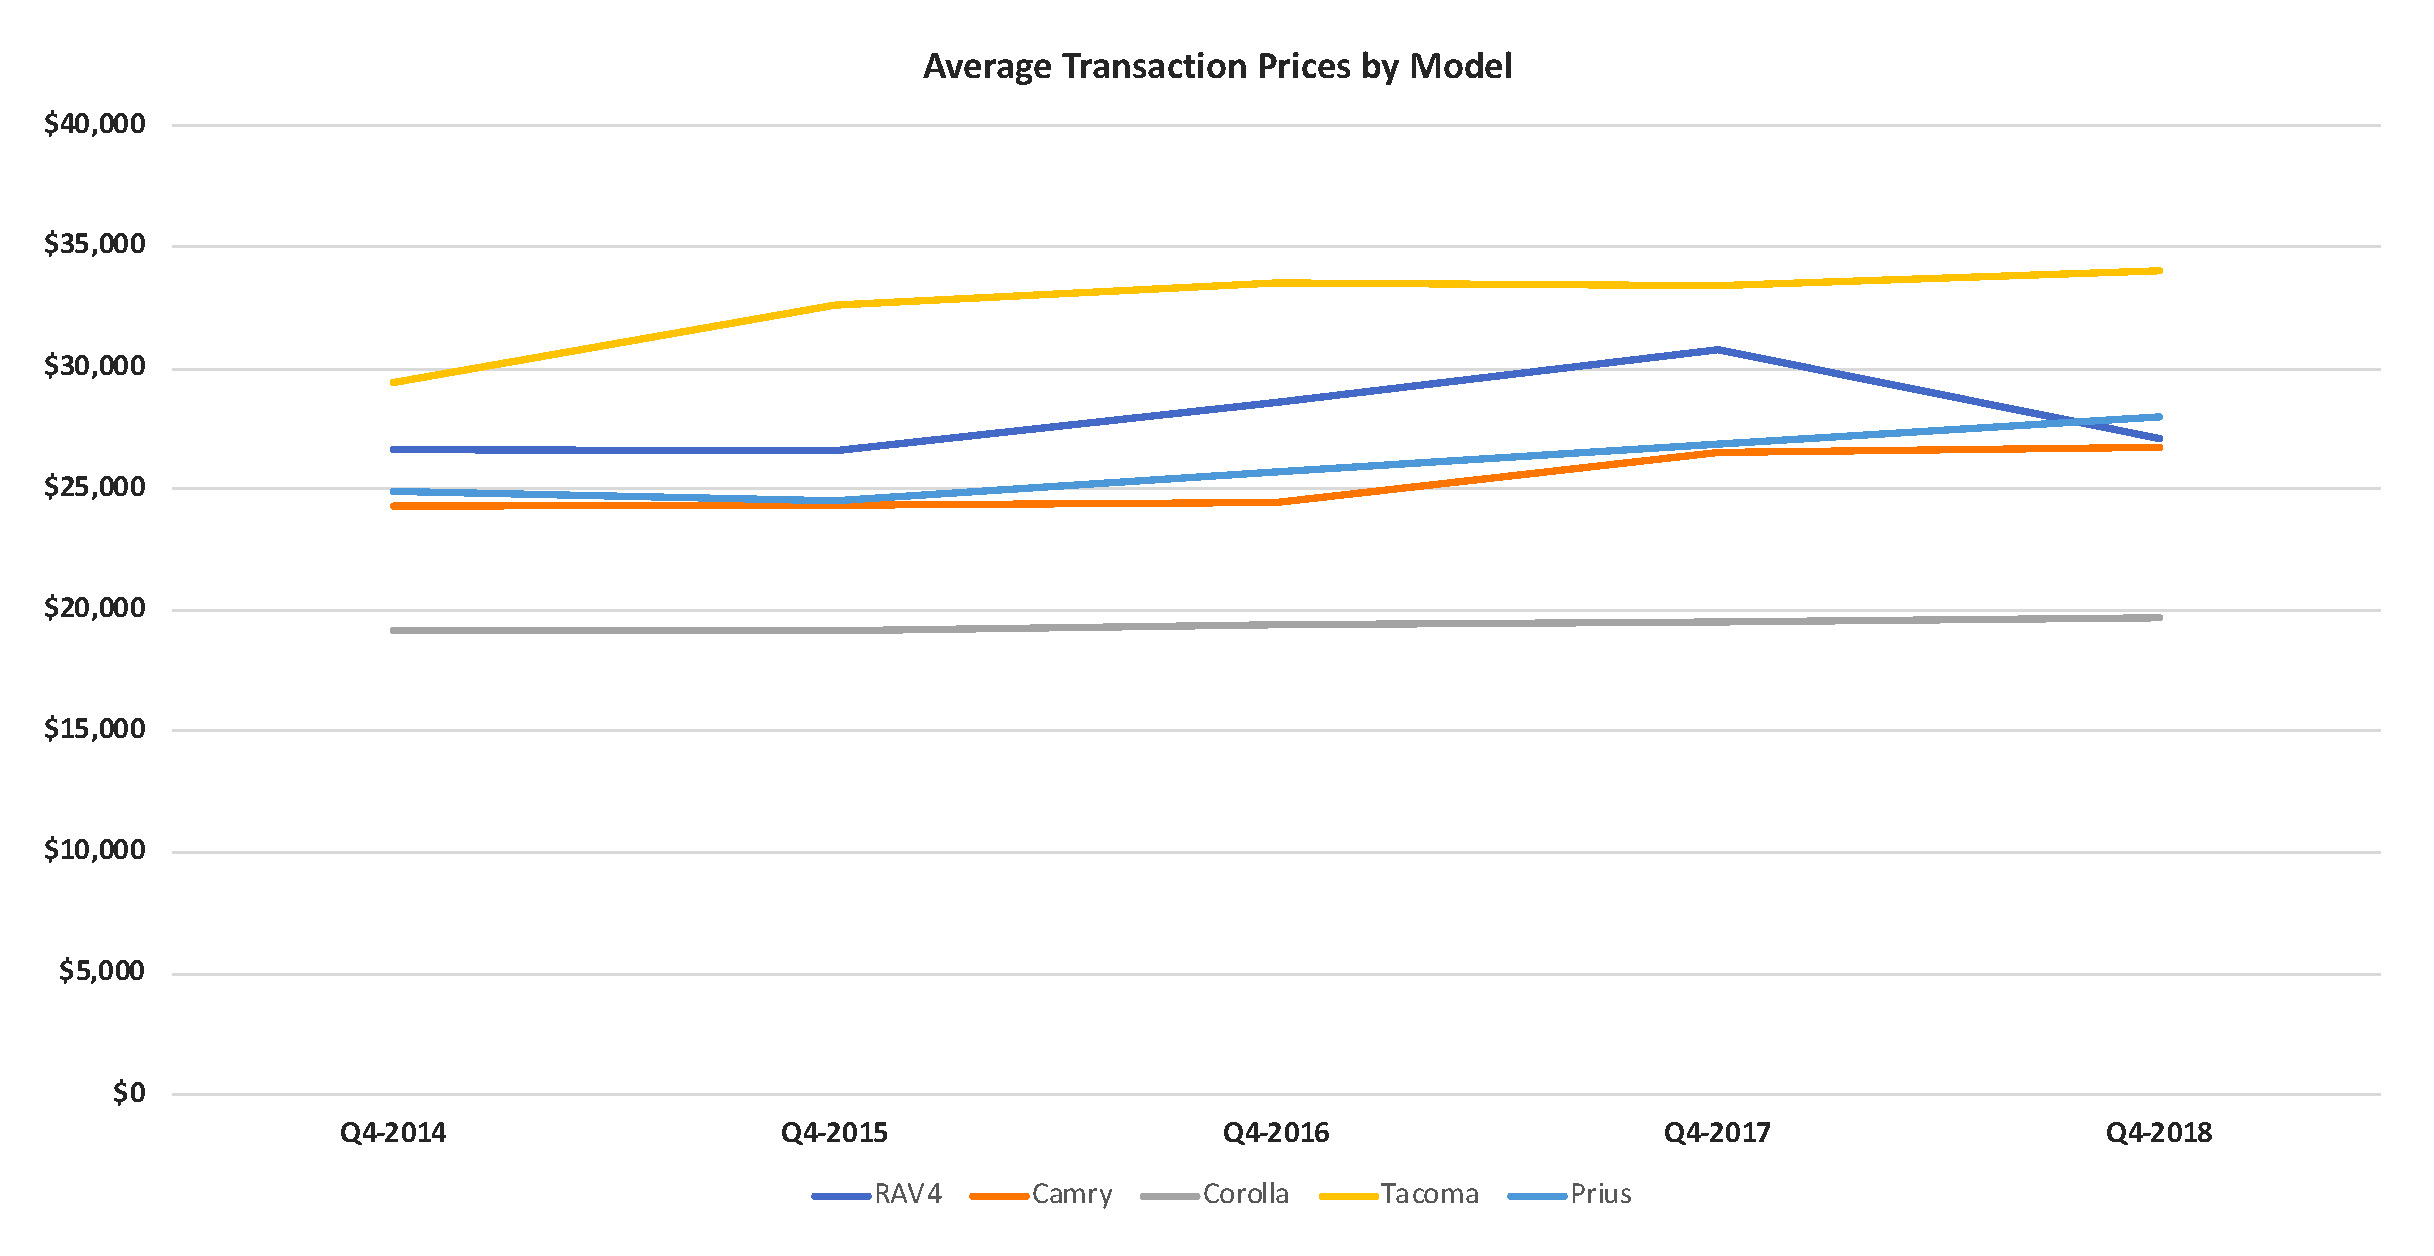
Toyota’s average transaction prices (ATP) on its most popular models were a mixed bag. The ATP on the RAV4 dropped by double digits, likely due to competition and discounting in the compact segment. ATPs on car lines eked higher as automakers generally toned down incentives in those segments.
