
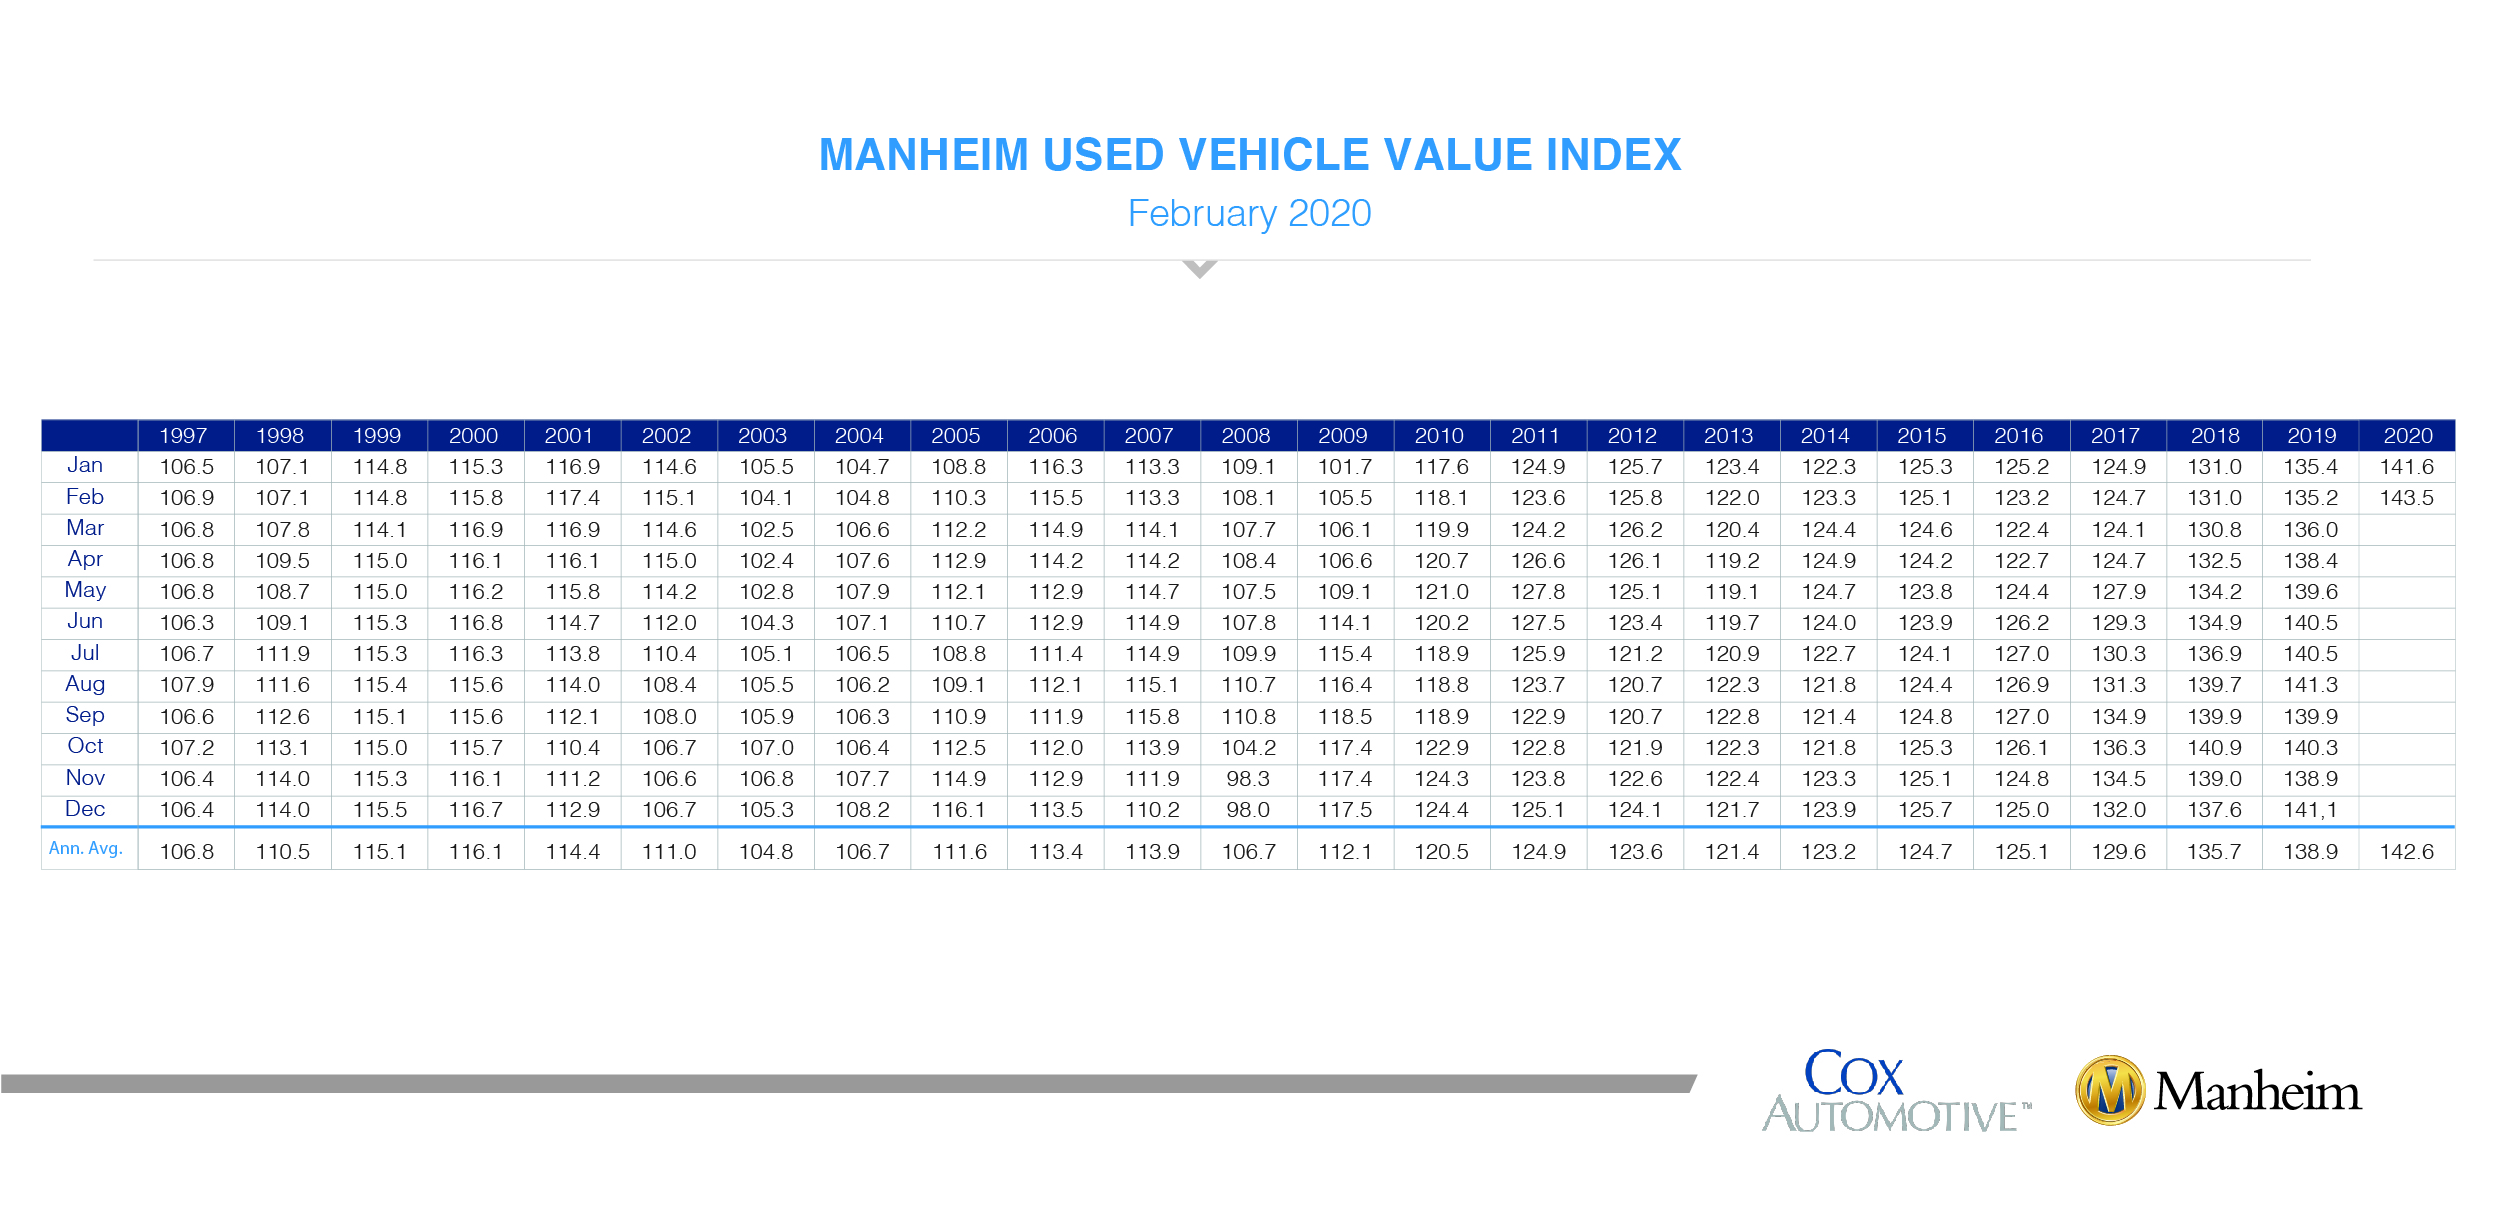
Wholesale used-vehicle prices (on a mix-, mileage-, and seasonally adjusted basis) increased 1.35% month over month in February. This brought the Manheim Used Vehicle Value Index to 143.5, a 6.2% increase from a year ago and a record high for the Index.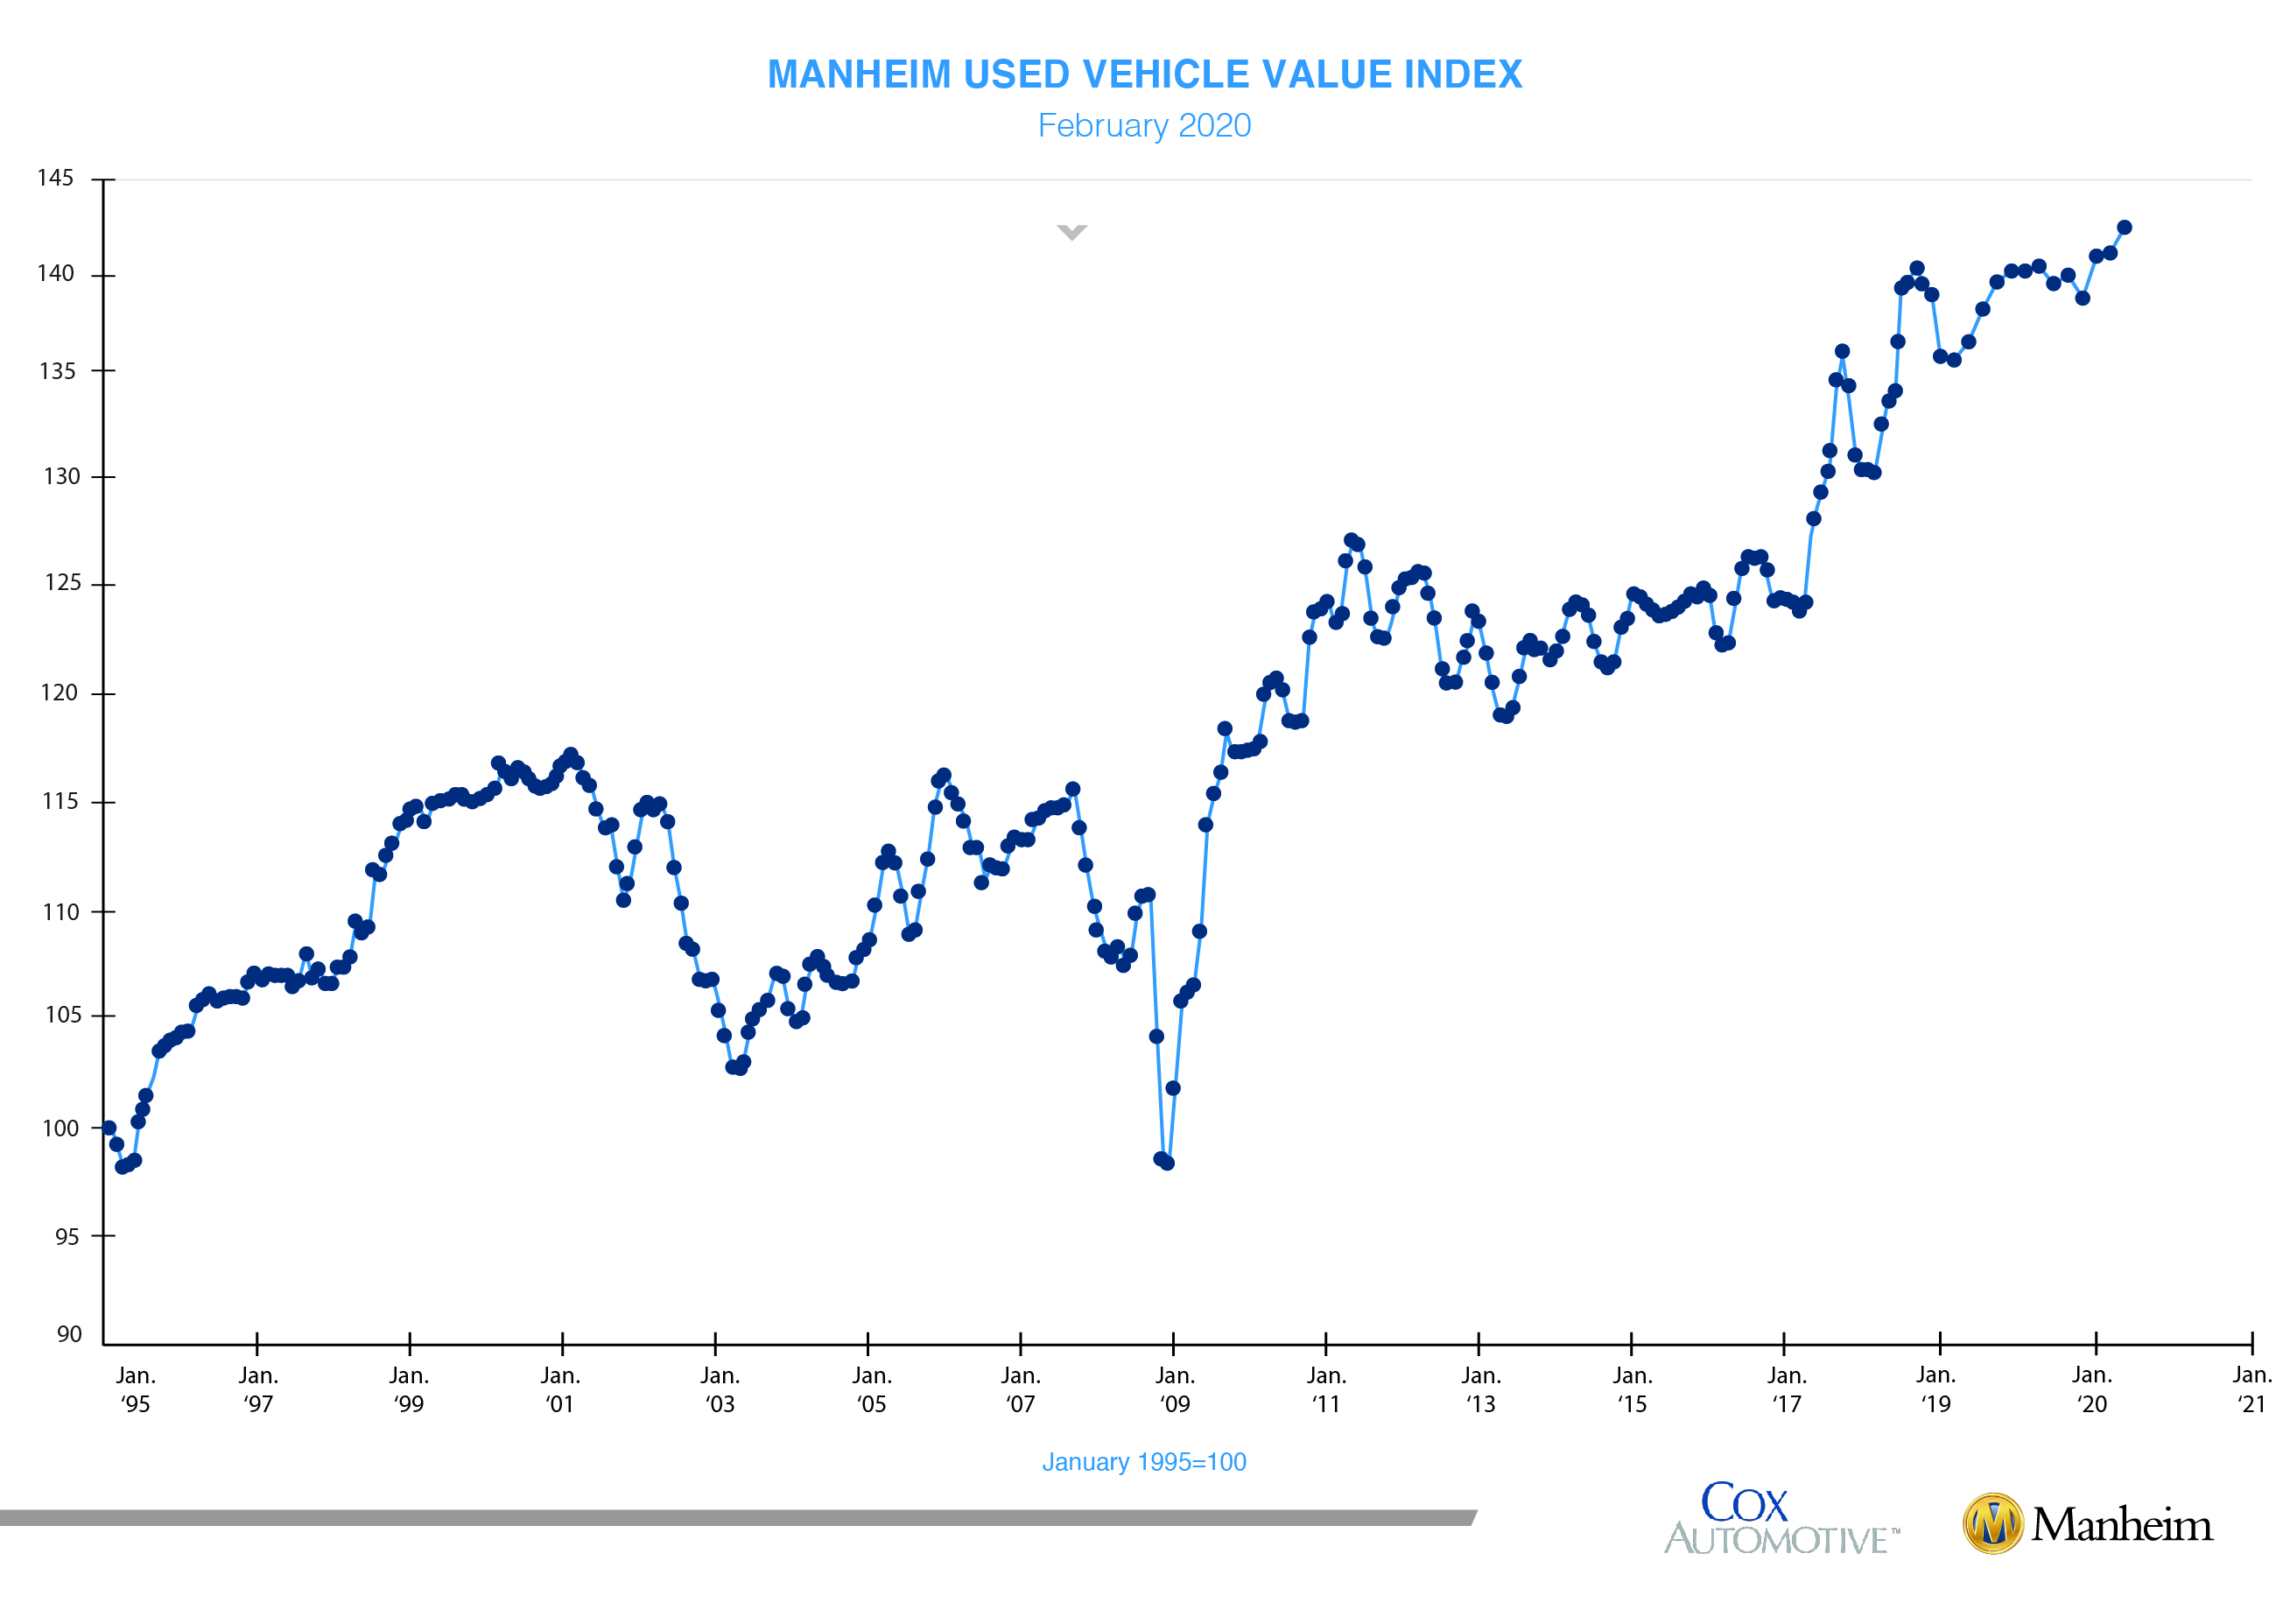
After a normal and steady trend in weekly Manheim Market Report (MMR) prices in January, February saw prices rise as the month ended. Three-year-old vehicle values in aggregate were up 1.1% for the month. Both non-luxury and luxury vehicles saw similar gains. This February’s performance was notably stronger than last year, as prices relative to the beginning of the year are up 0.9% when they were down 1.9% at this point last year.
On a year-over-year basis, all major market segments saw seasonally adjusted price increases in February. Luxury cars outperformed the overall market, while most other major segments underperformed the overall market.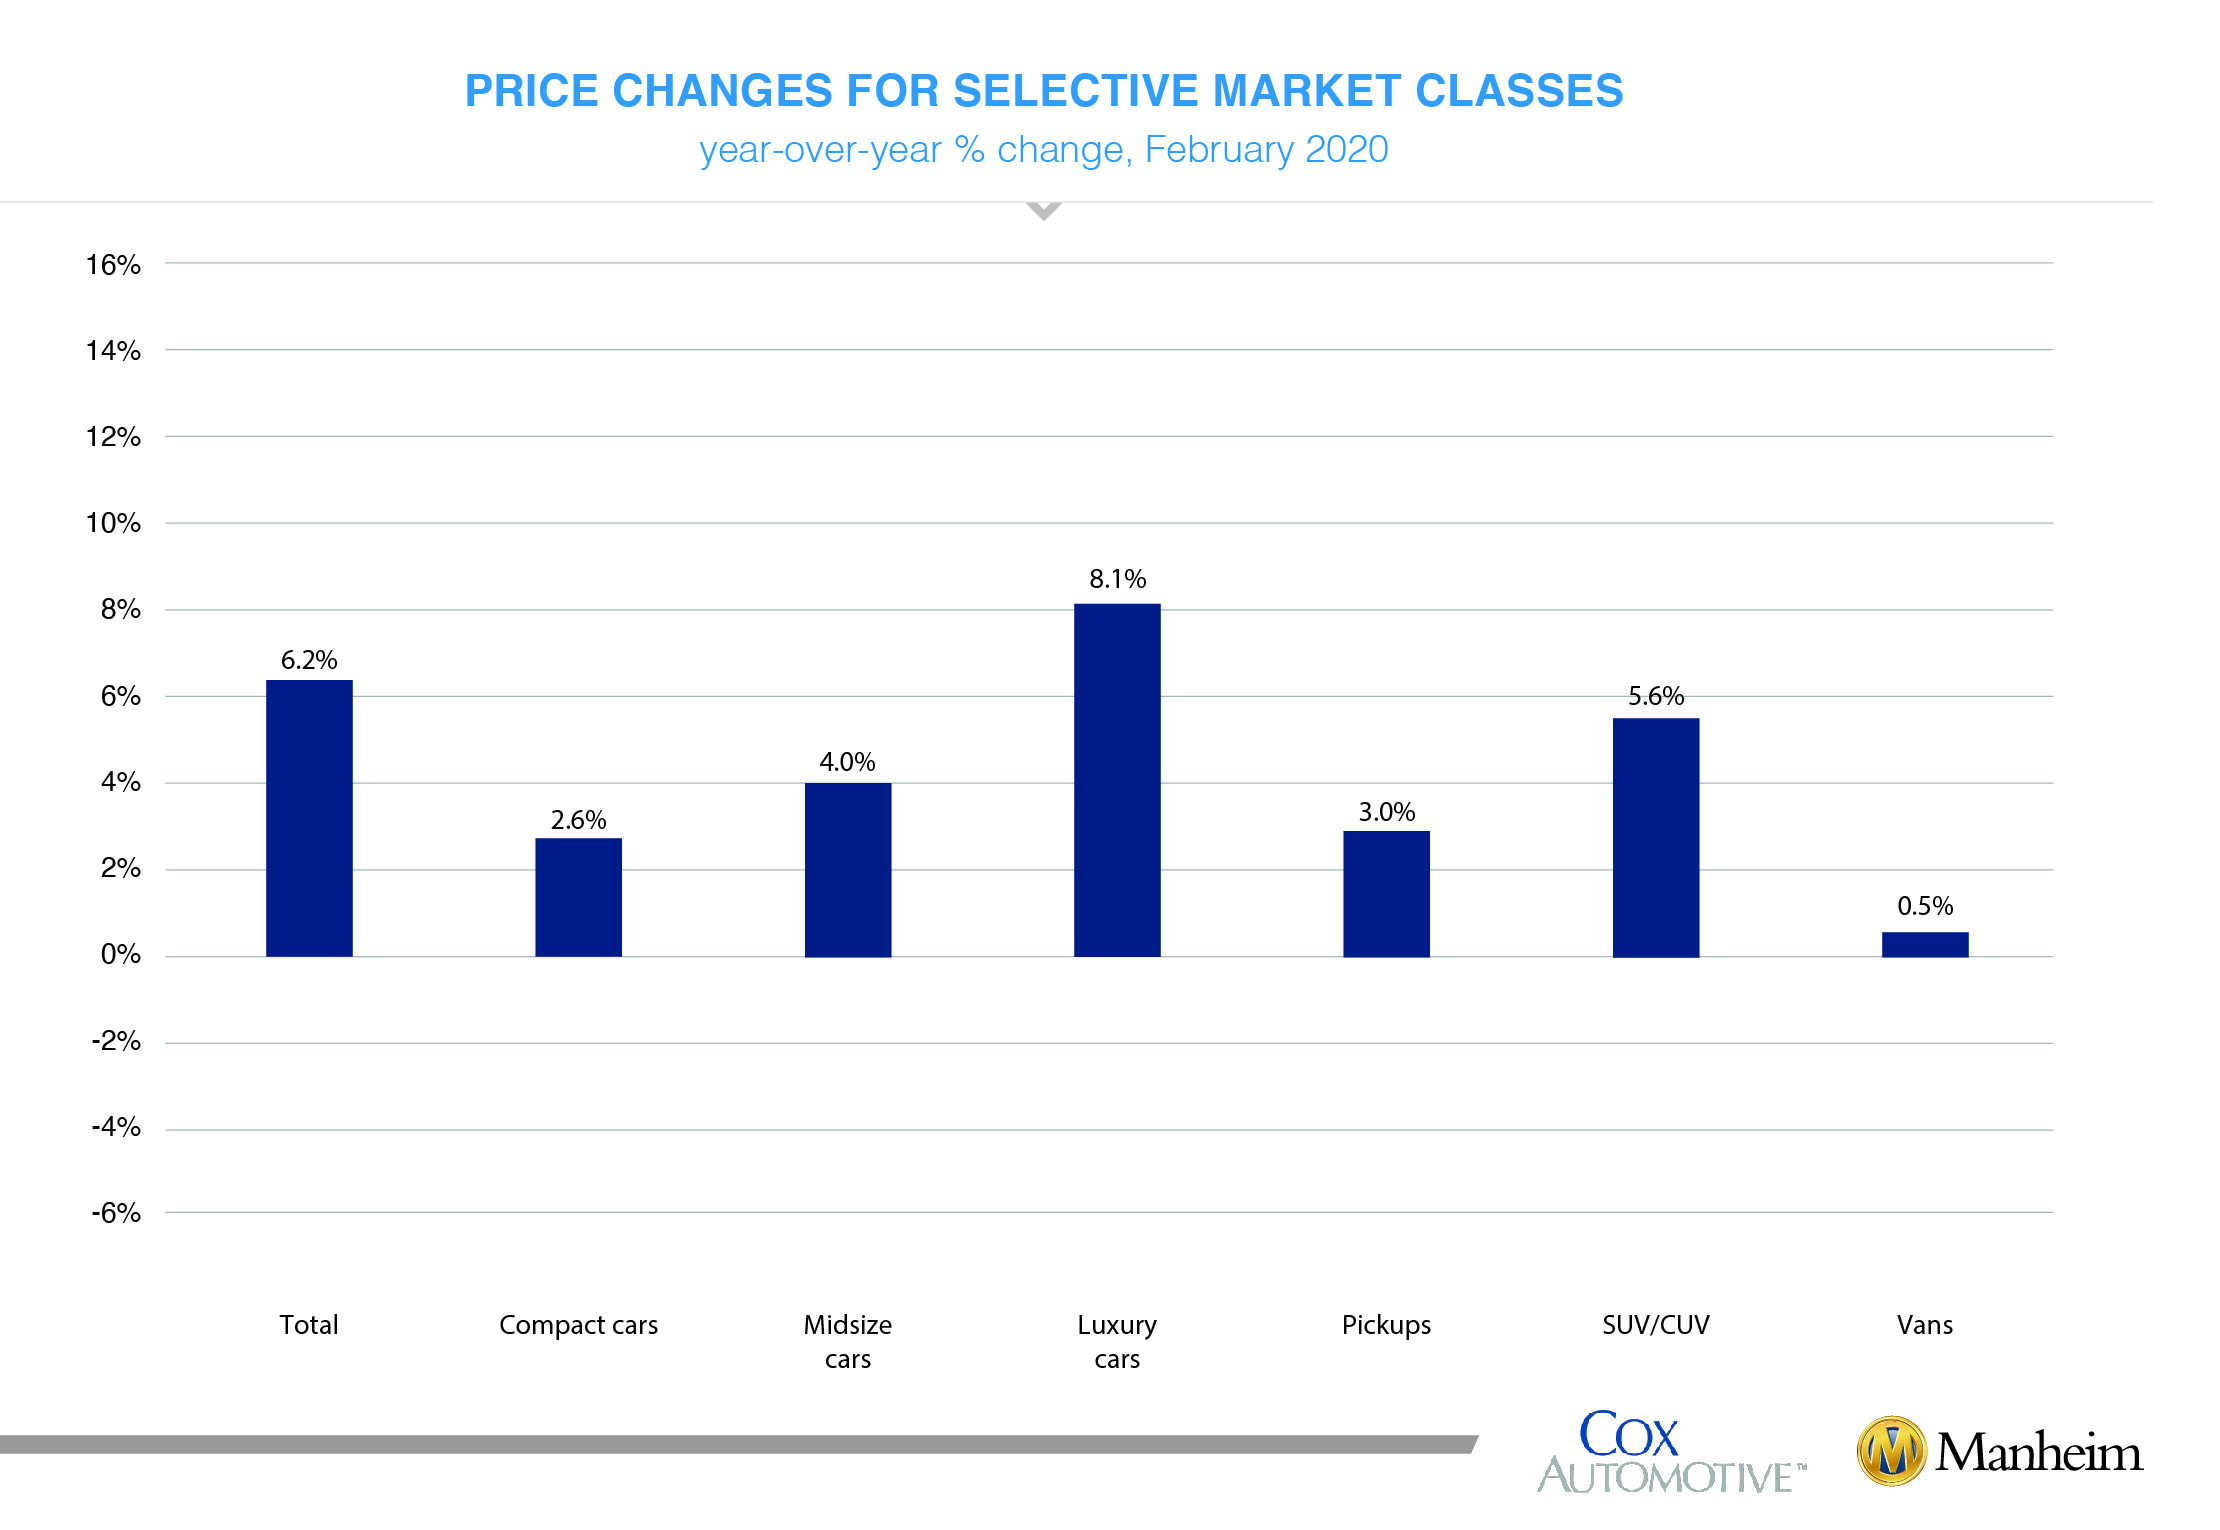
Positive retail results for vehicle sales year over year. According to Cox Automotive estimates, total used-vehicle sales volume was up 4.4% year over year in February. We estimate the February used SAAR to be 39.8 million, up from 39.4 million last February and up from January’s 39.5 million rate. The February used retail SAAR estimate is 21.2 million, up from 19.8 million last year and up month over month from January’s 20.7 million rate.
February total new-vehicle sales were up 8.4% year over year, with one more selling day compared to February 2019. The February SAAR came in at 16.8 million, an increase from last year’s 16.5 million and down from January’s 16.9 million rate.
Combined rental, commercial and government purchases of new vehicles were up 2.7% year over year in February. Commercial vehicle sales were up 8.7% year over year in February. Retail sales of new vehicles were up 9.9% in February, leading to a retail SAAR of 13.4 million, up from 12.9 million last February but down from January’s 13.9 million rate.
New-vehicle inventories came in under 3.6 million units.
Rental risk pricing increased. The average price for rental risk units sold at auction in February was up 6.4% year over year. Rental risk prices were up 0.9% compared to January. Average mileage for rental risk units in February (at 52,000 miles) was up 16% compared to a year ago and up 1% month over month.
Coronavirus uncertainty amid mixed conditions. The fourth quarter’s real GDP growth rate was left unchanged at 2.1%, but the underlying data were revised and revealed less robust consumer spending. The contributions from net exports and inventories was revised up, but consumer spending was revised down to growth of 1.7%. Business investment was also revised down to a bigger drop (now -2.3%). These trends would normally lead to much weaker growth in the first quarter, and that was before the impact of the coronavirus. New home sales, which are new contracts signed on newly constructed homes, blew through expectations and increased 7.9% in January to a 764,000 annualized rate, which was the highest in 12.5 years. New home sales were up 18.6% year over year. Pending home sales also beat expectations, increasing 5.2% in January, and are now up 6.7% year over year. Home sales will benefit further from mortgage rates’ falling even more in February. Updated data from the IRS through Feb. 21 show that refund volumes continue to be down year over year (-2.9% in number, -3.4% in total amount), and the average refund is also down year over year by 0.6%. We believe that tax refunds will be up in total and in amount once the IRS processes the majority of filings claiming tax credits, as higher employment, incomes and withholdings in 2019 point to more refunds in 2020.
The Manheim Used Vehicle Value Index data file is available for download.


