
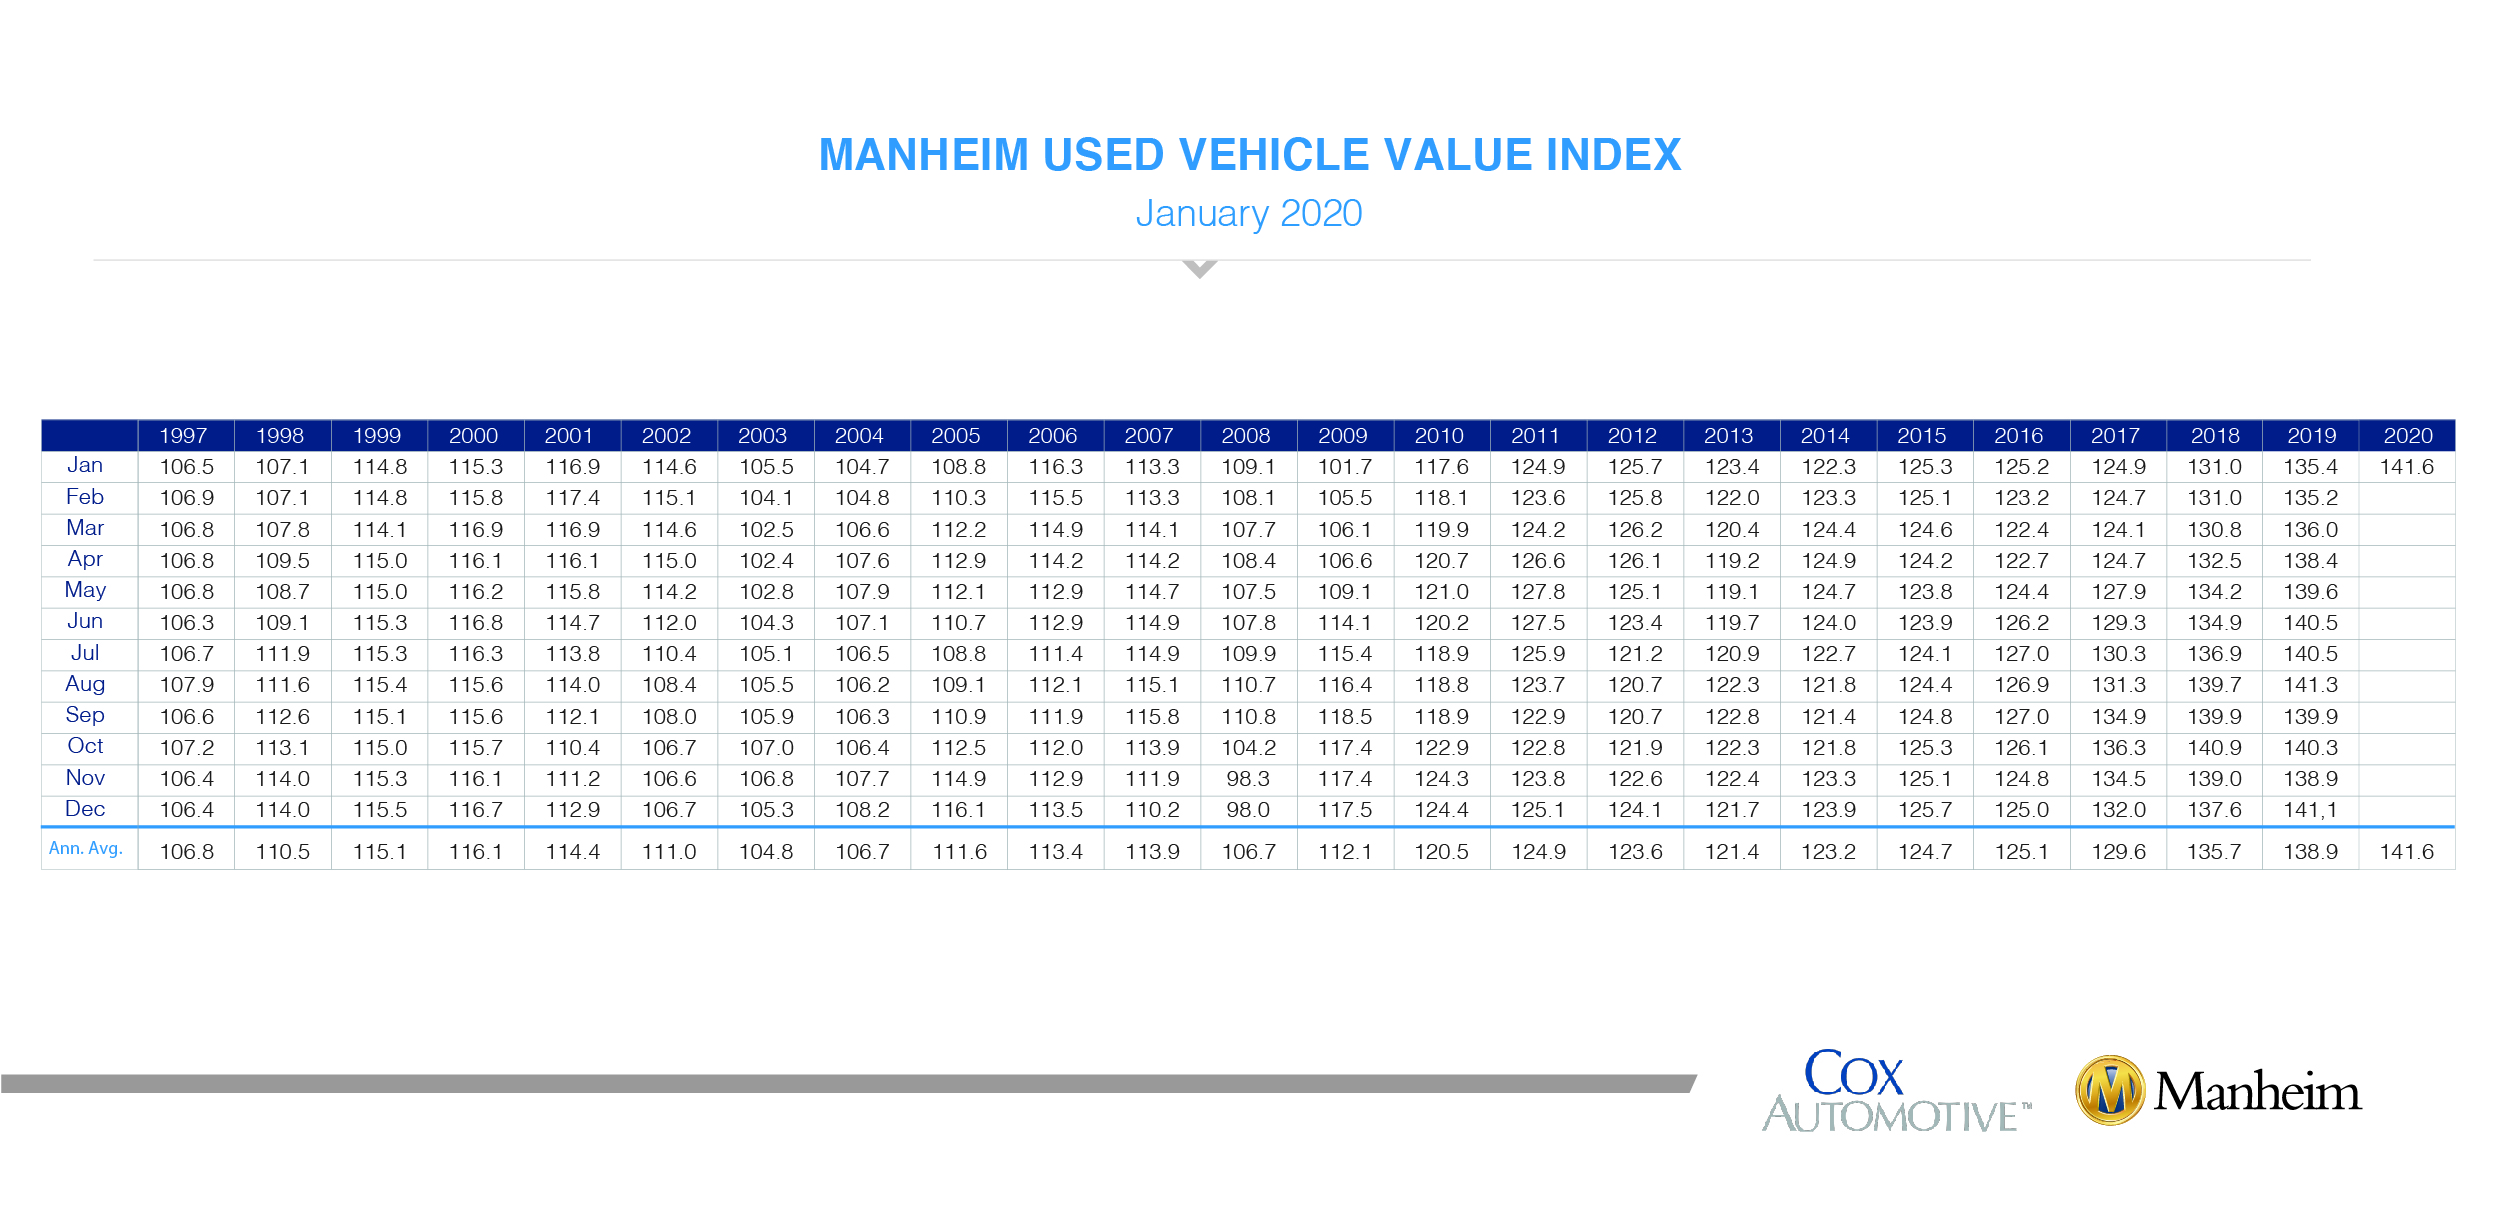
Wholesale used-vehicle prices (on a mix-, mileage-, and seasonally adjusted basis) increased 0.39% month over month in January. This brought the Manheim Used Vehicle Value Index to 141.6, a 4.6% increase from a year ago, setting a record high for the Index.
Following a normalizing trend in weekly Manheim Market Report (MMR) prices at the end of 2019, January saw steady prices as expected. Three-year-old vehicle values in aggregate were down 0.2% for the month. Non-luxury vehicles in aggregate saw no decline, while luxury vehicles in aggregate saw a decline of 0.7% for the month, which is in line with historical performance. This January’s normal trend for prices was a marked improvement over last year’s declines.
On a year-over-year basis, most major market segments saw seasonally adjusted price increases in January. Luxury cars outperformed the overall market, while most other major segments underperformed the overall market.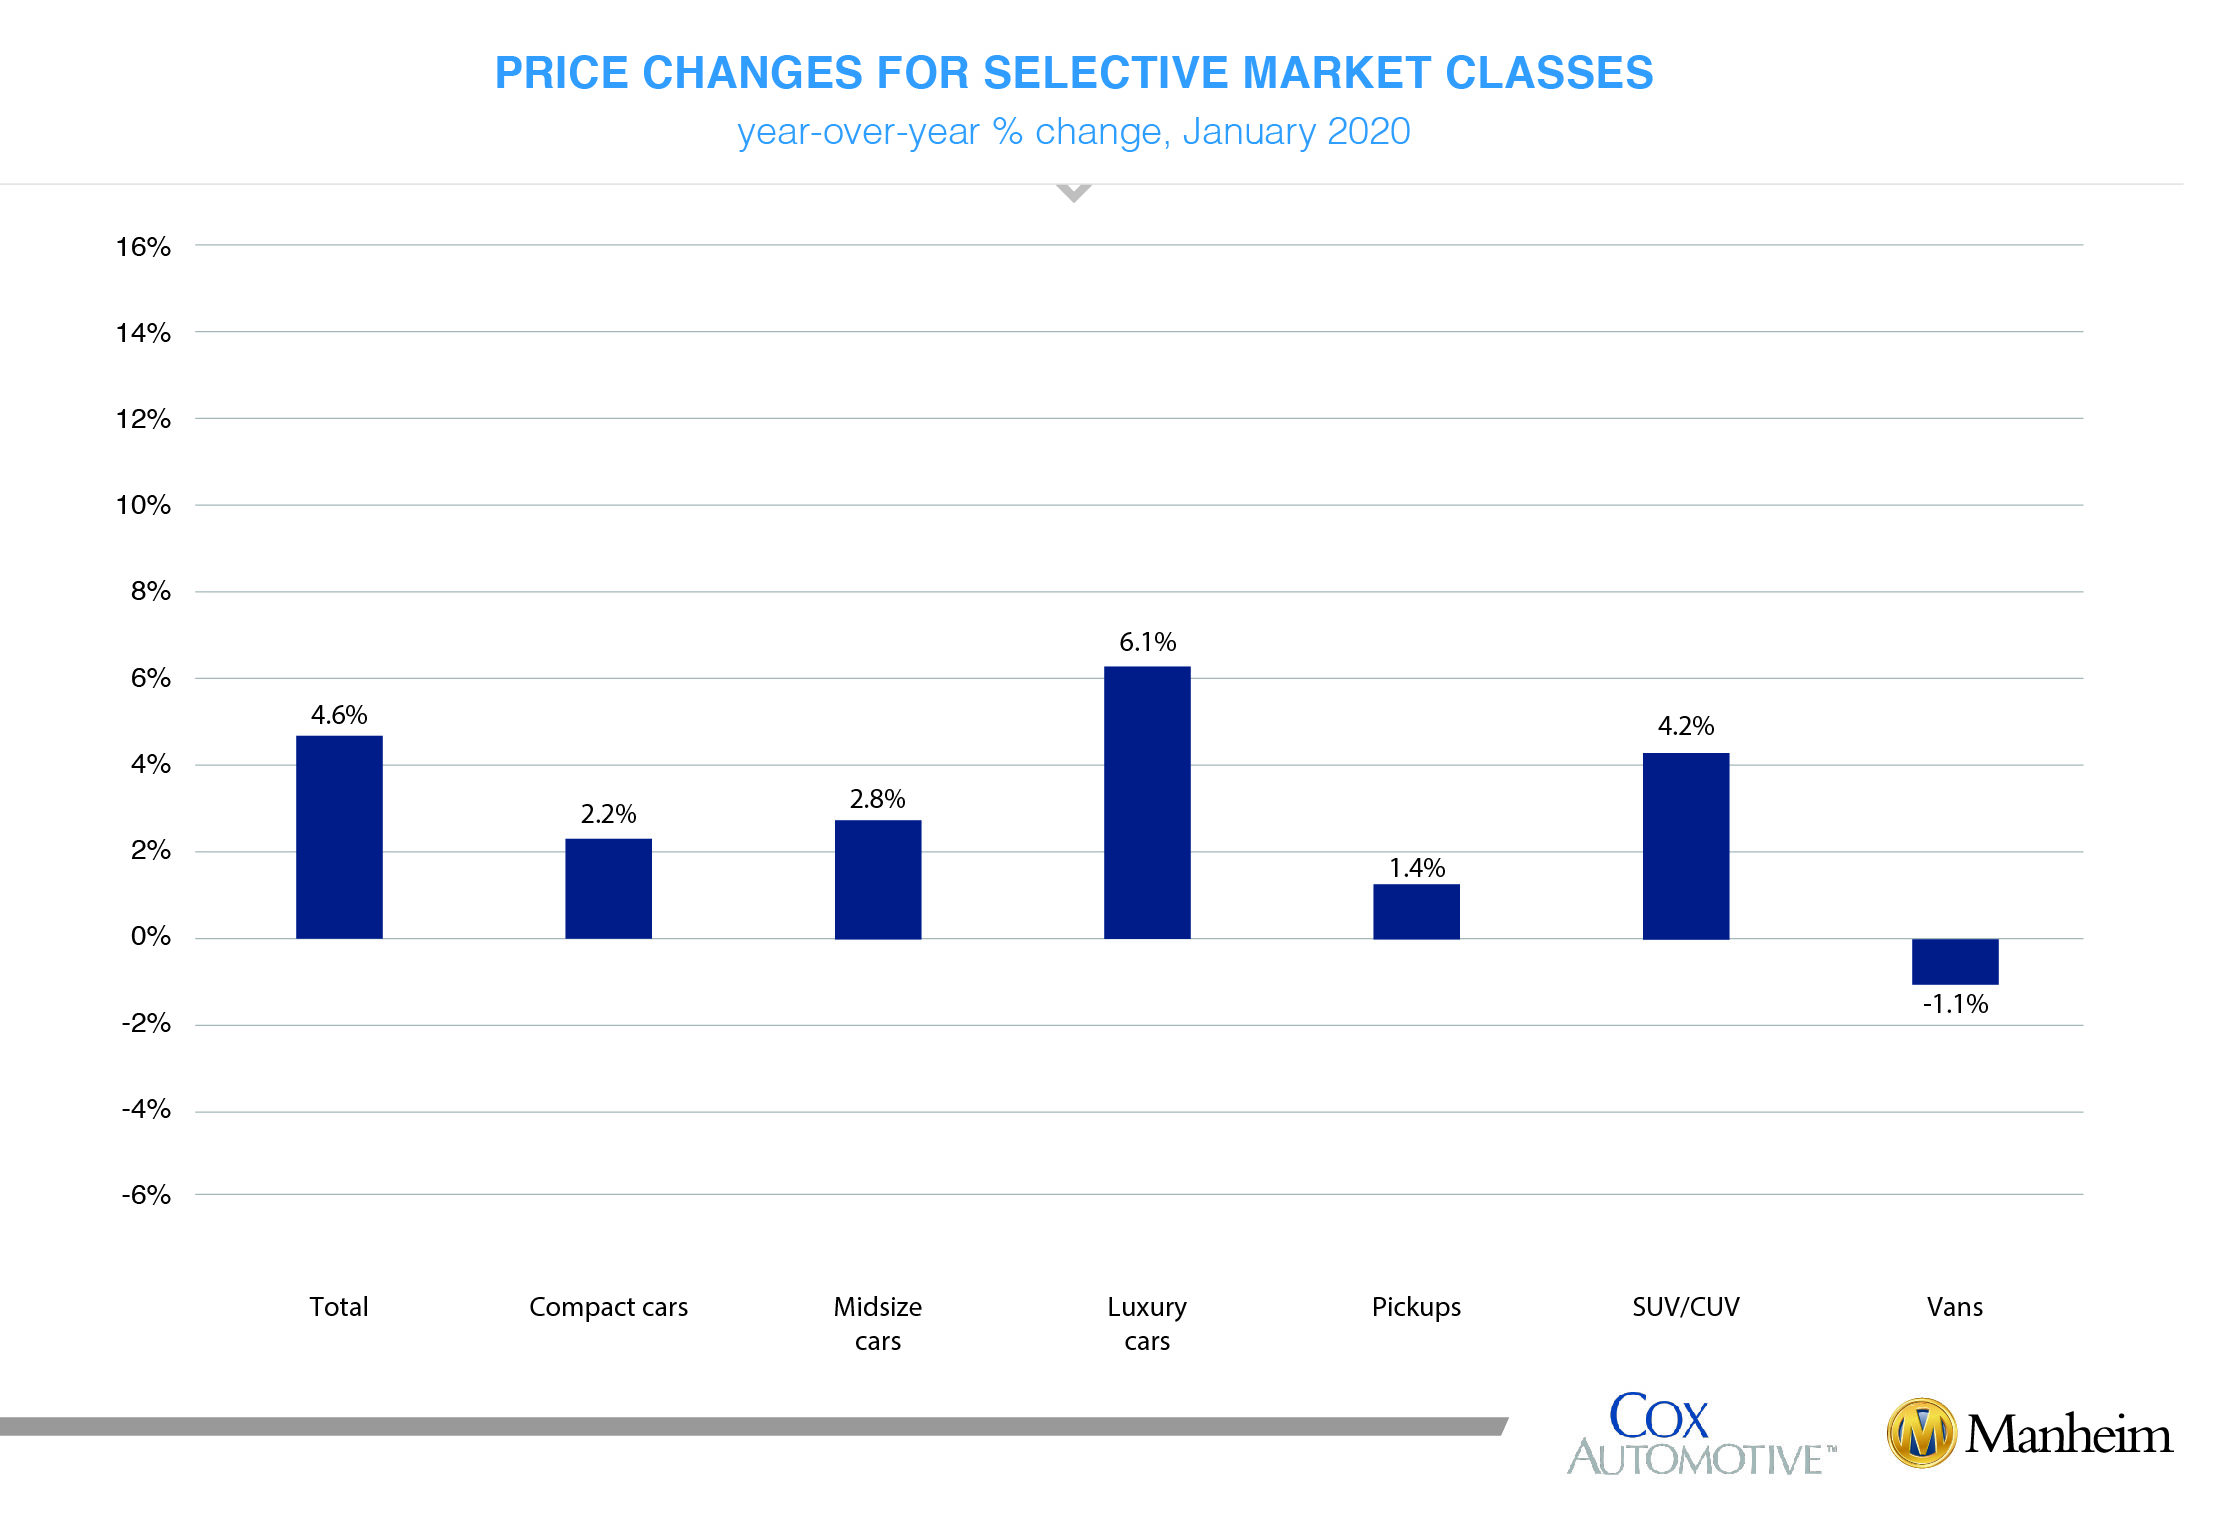
Positive retail results for vehicle sales year over year. According to Cox Automotive estimates, total used-vehicle sales volume was up 2.8% year over year in January. We estimate the January used SAAR to be 39.5 million, up from 38.8 million last January but down from December’s 40.0 million rate. The January used retail SAAR estimate is 20.7 million, up from 19.8 million last year and up month-over-month from December’s 20.1 million rate.
January total new-vehicle sales were down 0.2% year over year, with the same number of selling days compared to January 2019. The January SAAR came in at 16.8 million, an increase from last year’s 16.7 million and up from December’s 16.7 million rate.
Combined rental, commercial, and government purchases of new vehicles were down 5.3% year-over-year in January. Commercial vehicle sales were up 3.7% year-over-year in January. Retail sales of new vehicles were up 1.0% in January, leading to a retail SAAR of 13.8 million, up from 13.5 million last January and down from December’s 14.2 million rate.
New-vehicle inventories came in under 3.5 million units.
Rental risk pricing increased. The average price for rental risk units sold at auction in January was up 4.4% year-over-year. Rental risk prices were up 1.0% compared to December. Average mileage for rental risk units in January (at 51,300 miles) was up 9% compared to a year ago and down 0.3% month-over-month.
Improved consumer confidence amid mixed conditions. The U.S. economy experienced an estimated 2.1% real GDP growth in the final quarter of 2019. The growth rate was the same as Q3 and slightly better than consensus estimates. Personal consumption growth slowed to 1.8% from 3.2% in Q3, which was down from 4.6% in Q2. The consumer contribution to growth is slipping. Consumers spent on durable goods, which saw a 2.1% increase in Q4 but down substantially from 8.1% in Q3 and 13% in Q2. Consumer confidence, as measured by the Conference Board, increased 2.1% in January after remaining flat for the prior three months. December’s confidence index was also revised up. The better end to 2019 with the revision and the strong start to January were related to the Phase 1 Trade Deal with China. The January survey was conducted prior to the news breaking about the Wuhan coronavirus.
The Manheim Used Vehicle Value Index data file is available for download.


