
Incentive program volume in Q1 2021 was down 13.9% from Q1 2020, as tight inventories and healthy demand helped keep the market moving. Program volume – a count of the number of vehicle incentive programs offered by the automakers – was at an all-time high in Q1 2020, according to an analysis by Cox Automotive Rates & Incentives.
The high program count was fueled last year by a significant number of incentive program changes in January 2020 and then additional shifts in March 2020, as the global pandemic set in and incentive programs were quickly altered. As automakers shift and alter programs through the month – an indication current programs are not having the desired effect – the volume count increases.
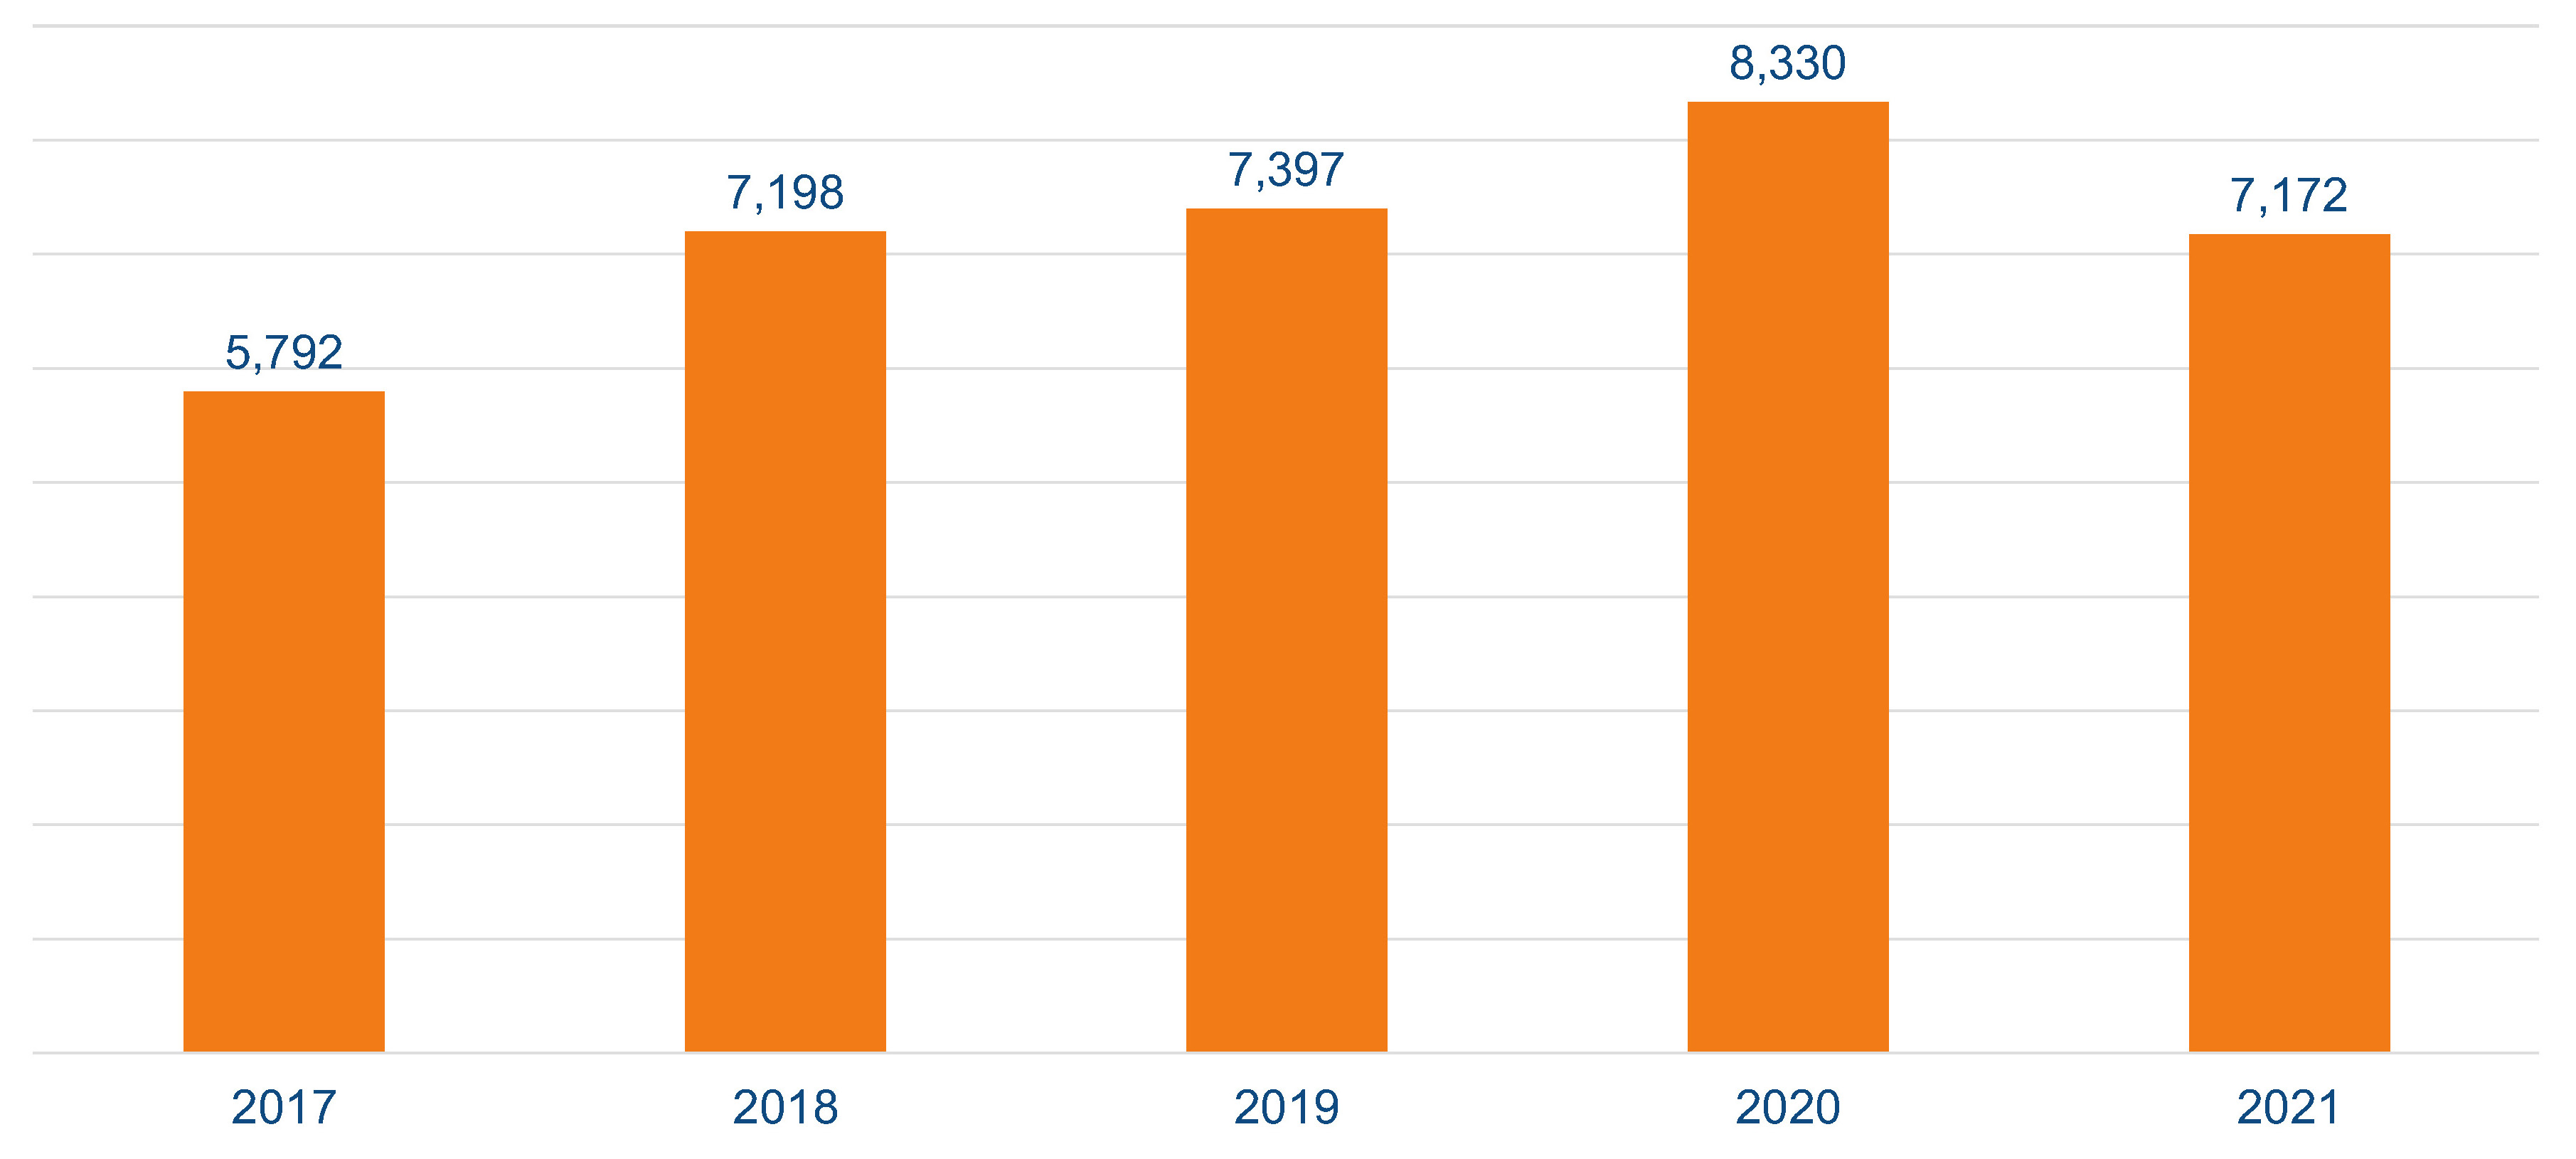
Q1 Incentive Program Count: 2017 – 2021
Incentive program volume in Q1 2021 has been more consistent and relatively stable month to month and roughly on par with program volumes seen in 2018 and 2019. The lower program count is likely reflective of a market where supply and demand are relatively balanced. Incentive spending as a percent of average transaction price has also been down in Q1, according to an analysis by our Kelley Blue Book team.
Inventory levels have yet to fully recover from the pandemic-induced shutdown last spring, and recent disruptions in the supply chain have caused further production issues. With tight supply and sufficient demand, fewer incentive programs and lower incentive spending will likely be the norm through much of 2021.
The Cox Automotive Rates & Incentives (CAR&I) team has developed a methodology for measuring the accuracy of data used to calculate pricing and payment information presented through dealer service provider tools (e.g., dealer websites, inventory management, digital retailing & advertising, desking, equity, etc.). Approximately 17,500 individual dealerships – rooftops, in automotive parlance – in the U.S. rely on CAR&I incentive data for powering 5 different software applications through Cox Automotive native software/sites and our many industry partners. In all, an estimated 90,000 applications are relying on CAR&I data in a given month, providing valuable information to 40 million shoppers.


