Comparison of home and auto sales
The Auto Industry in Perspective Infographic
Tuesday February 13, 2018
Article Highlights
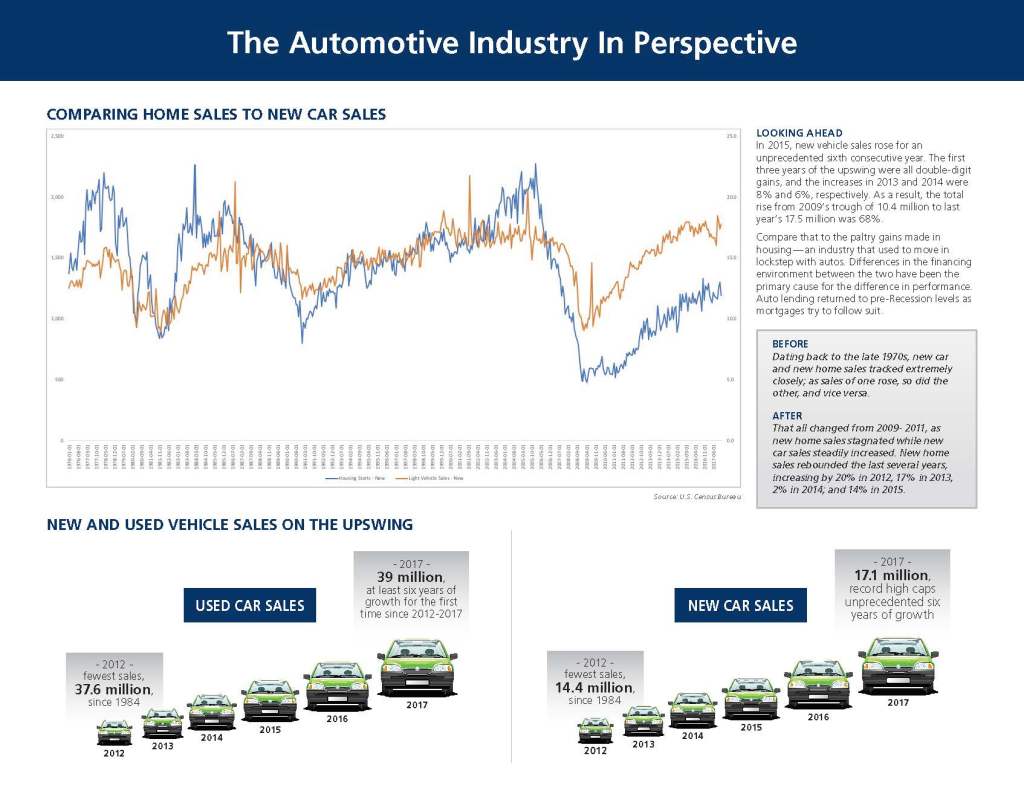
- In 2015, new vehicle sales rose for an unprecedented sixth consecutive year. The first three years of the upswing were all double-digit gains, and the increases in 2013 and 2014 were 8% and 6%, respectively.
- As a result, the total rise from 2009’s trough of 10.4 million to last year’s 17.5 million was 68%.
- Compare that to the paltry gains made in housing — an industry that used to move in lockstep with autos. Differences in the financing environment between the two have been the primary cause for the difference in performance. Auto lending returned to pre-Recession levels as mortgages try to follow suit.
This infographic compares home sales with auto sales and explains why the two industries are no longer in lockstep. Differences in the financing environment between the two have been the primary cause for the difference in performance. Auto lending returned to pre-Recession levels as mortgages try to follow suit.
The Auto Industry in Perspective Infographic
This infographic compares home sales with auto sales and explains why the two industries are no longer in lockstep.
Download