Commentary & Voices
Seasonally Adjusted Wholesale Prices Improve Slightly
Thursday November 7, 2019
Article Highlights
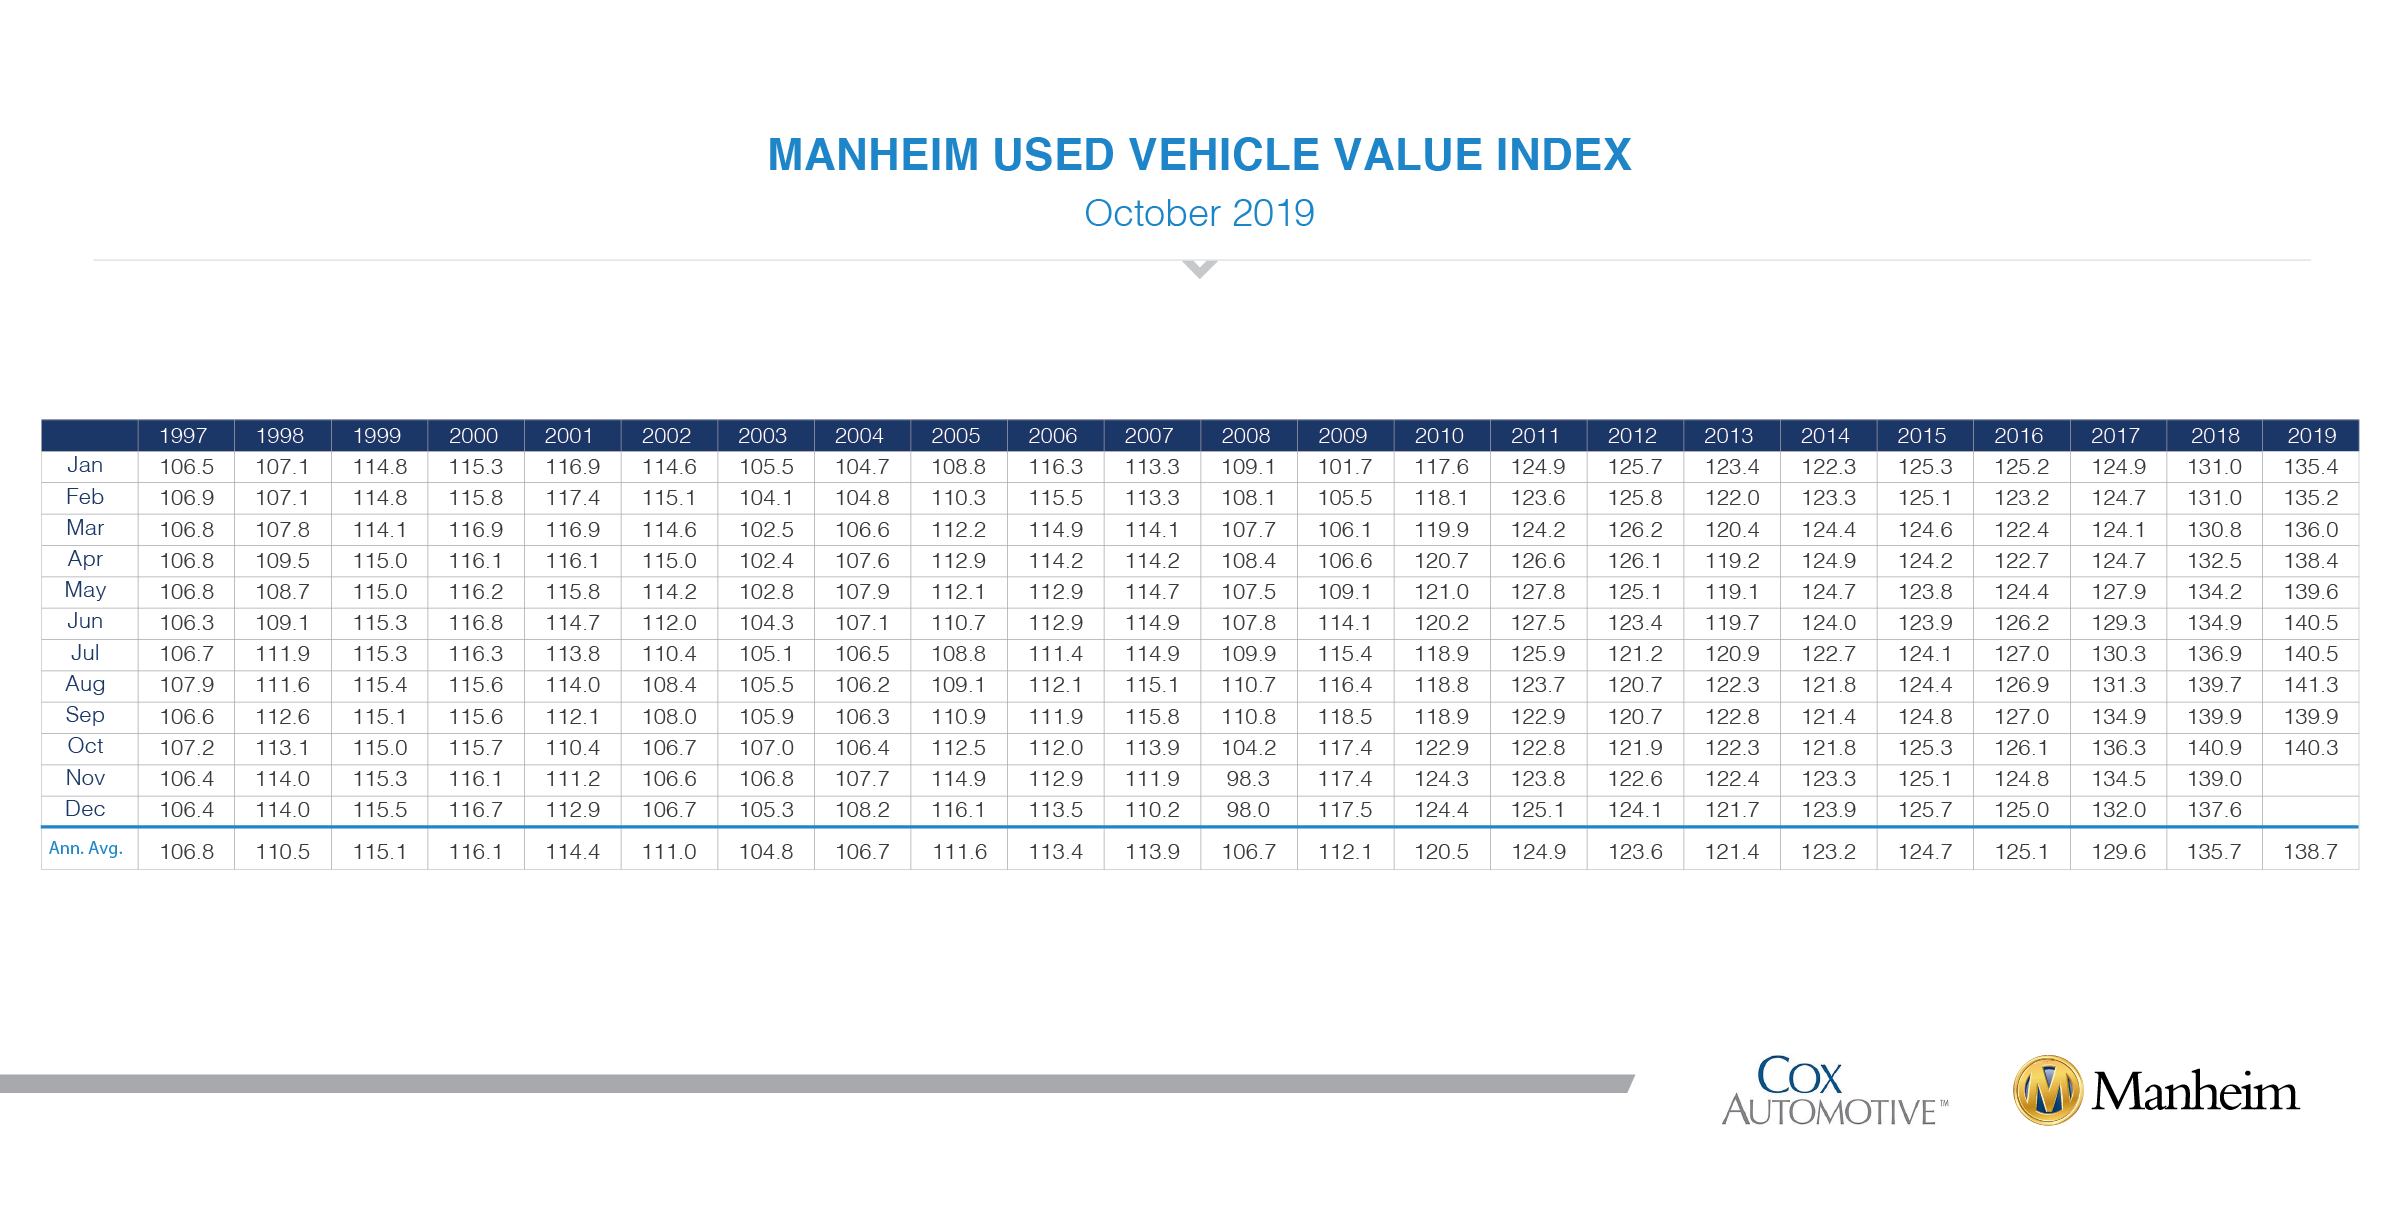
- 140.3, a 0.4% decrease from a year ago, and the first year-over-year decline for the Index in 33 months.
- On a year-over-year basis, most major market segments saw seasonally adjusted price declines in October.
- According to Cox Automotive estimates, total used vehicle sales volume was up 1.4% year over year in October.
Wholesale used-vehicle prices (on a mix-, mileage-, and seasonally adjusted basis) increased 0.29% month over month in October. This brought the Manheim Used Vehicle Value Index to 140.3, a 0.4% decrease from a year ago, and the first year-over-year decline for the Index in 33 months.
Weekly Manheim Market Report (MMR) prices continued to exhibit an accelerating depreciation pattern that began in September and peaked midway through October. Three-year-old vehicle values in aggregate were down 4% for the month, when prices normally decline by 1.5-2%. The above-average depreciation trend occurred in all major market segments. As a result of this higher depreciation, prices in aggregate relative to the beginning of the year are now lower than either of the last two years.
On a year-over-year basis, most major market segments saw seasonally adjusted price declines in October. Luxury cars outperformed the overall market, while most other major segments underperformed the overall market. Last year, especially October, continues to be a tough comparison for prices as we reached a record in the Manheim Index because of abnormally strong consumer demand in the fall related to tariff fears and rising interest rates. A year ago, dealers were willing to spend a record amount for used-vehicle inventory to take advantage of very strong new- and used-vehicle demand.
Mixed retail results for vehicle sales year over year. According to Cox Automotive estimates, total used-vehicle sales volume was up 1.4% year over year in October. We estimate the October used SAAR to be 39.6 million, up from 38.1 million last October and down from September’s 39.8 million rate. The October used retail SAAR estimate is 20.6 million, up from 19.8 million last year and slightly up month over month from September’s 20 million rate. [See more details on the 13-month rolling used-vehicle SAAR.]
October total new-vehicle sales were down 1.8% year-over-year, with one more selling day compared to October 2018. The October SAAR came in at 16.5 million, a decline from last year’s 17.5 million and also down from September’s 17.1 million rate. The decline in sales represented by sedans continues as car share in October was 26% ̶̶ the lowest percentage on record.
Strong fleet sales have supported the new-vehicle market this year, but growth is slowing down. Combined rental, commercial, and government purchases of new vehicles were down 10.8% year-over-year in October. The commercial fleet channel was particularly strong, up 17% year-over-year last month. Retail sales of new vehicles were down 0.2% in October, leading to a retail SAAR of 14.3 million, down from 14.9 million last October and the weakest retail SAAR over the last four months. Fleet sales are up 4.3% in 2019 through October, and retail sales are down 2.3%, as the overall new vehicle market is down 1.2% this year.
New-vehicle inventories came in under 4 million units for the sixth consecutive month.
Rental risk pricing declines. The average price for rental risk units sold at auction in October was down 1.6% year over year. Rental risk prices were down 4.8% compared to September. Average mileage for rental risk units in October (at 48,100 miles) was up 3% compared to a year ago and up 2% month over month.
Continued consumer spending amid mixed conditions. The first estimate of third-quarter real GDP growth came in at 1.9% and continued the streak of declining growth observed each quarter this year. Consumer spending again drove the economy with a 2.9% increase, which accounted for nearly all of the growth. The October employment report provided evidence of a slower but stabilizing economy. Job creation slowed to 128,000 when analysts had expected only 85,000, and the prior two monthly numbers were revised up for a net increase of 95,000 more jobs than originally estimated. Consumer Confidence, as measured by the Conference Board, declined modestly in October after a substantial decline in September. The percentage of households reporting plans to purchase a vehicle in the next 6 months declined to its lowest level in 4 years in October.
The Manheim Used Vehicle Value Index data file is available for download.