Economic outlook
Cox Automotive Industry Update Report: January 2020
Friday January 17, 2020
The January 2020 Cox Automotive Industry Update Report shares Cox Automotive’s multifaceted insight into the automotive marketplace to provide an overview of economic indicators, supply, demand, credit and other vital topics and trends affecting the industry.
ECONOMIC INDICATORS
- Consumer sentiment declined in December based on the final data for the month from the University of Michigan. The consumer confidence index disappointed in December as the index declined 0.2% when analysts had expected an increase. Consumer confidence ended the year down slightly from last year.
- Housing has been a contributor to economic growth in 2019, and the trends at year-end suggest continued strength. Home sales activity strengthened this spring and summer aided by lower mortgage rates, and October saw a rebound in existing home sales following a decline in September. New home sales, which are new contracts on newly constructed homes, increased 1.3% in November and are up 17% y/y. Pending home sales, which are new contracts signed on existing homes, increased 1.2% in November and are up 5.6% y/y.
DEMAND
- December total new vehicle sales were down 6.3% y/y, with one less selling day compared to December 2018. The December SAAR came in at 16.7 million, a decline from last year’s 17.4 million and down from November’s 17.1 million rate. New light vehicle sales in 2019 decreased 1.4% versus the prior year to 16.97 million vehicles.
- CPO sales increased 5.3% in December y/y but were down 0.7% m/m. CPO sales finished the year at 2.80 million units, a new record for the industry as sales increased 4% versus 2018.
- Combined rental, commercial, and government purchases of new vehicles were down 0.7% y/y in December. Retail sales of new vehicles were down 7.1% in December, leading to a retail SAAR of 14.3 million, down from 15.0 million last December and down from November’s 14.8 million rate. Fleet sales were up 2.9% in 2019, and retail sales were down 2.3%, as the overall new vehicle market finished the year down 1.4%.
SUPPLY
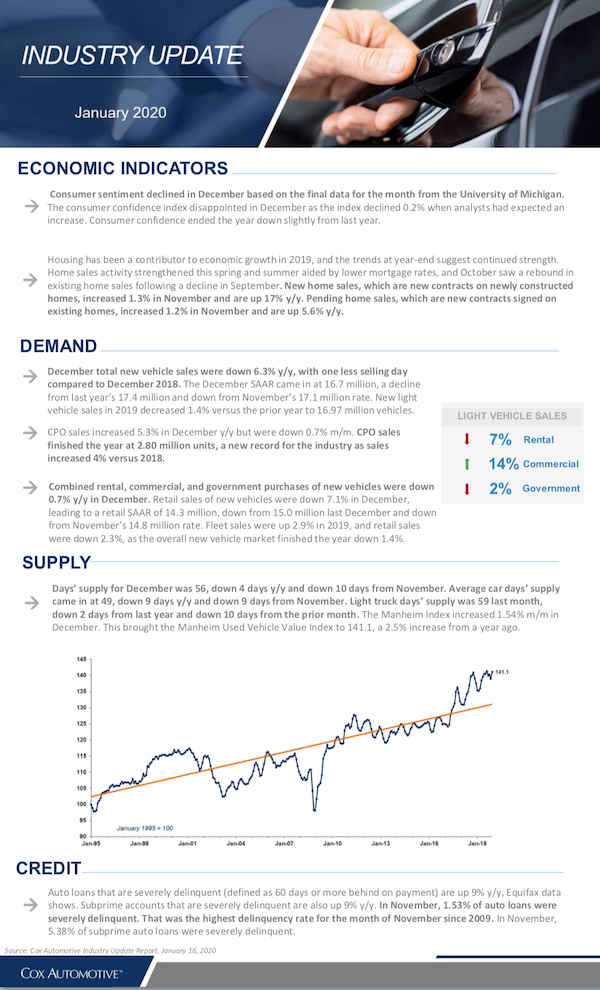
- Days’ supply for December was 56, down 4 days y/y and down 10 days from November. Average car days’ supply came in at 49, down 9 days y/y and down 9 days from November. Light truck days’ supply was 59 last month, down 2 days from last year and down 10 days from the prior month. The Manheim Index increased 1.54% m/m in December. This brought the Manheim Used Vehicle Value Index to 141.1, a 2.5% increase from a year ago.
CREDIT
- Auto loans that are severely delinquent (defined as 60 days or more behind on payment) are up 9% y/y, Equifax data shows. Subprime accounts that are severely delinquent are also up 9% y/y. In November, 1.53% of auto loans were severely delinquent. That was the highest delinquency rate for the month of November since 2009. In November, 5.38% of subprime auto loans were severely delinquent.