Economic outlook
Cox Automotive Industry Update Report: April 2020
Wednesday April 22, 2020
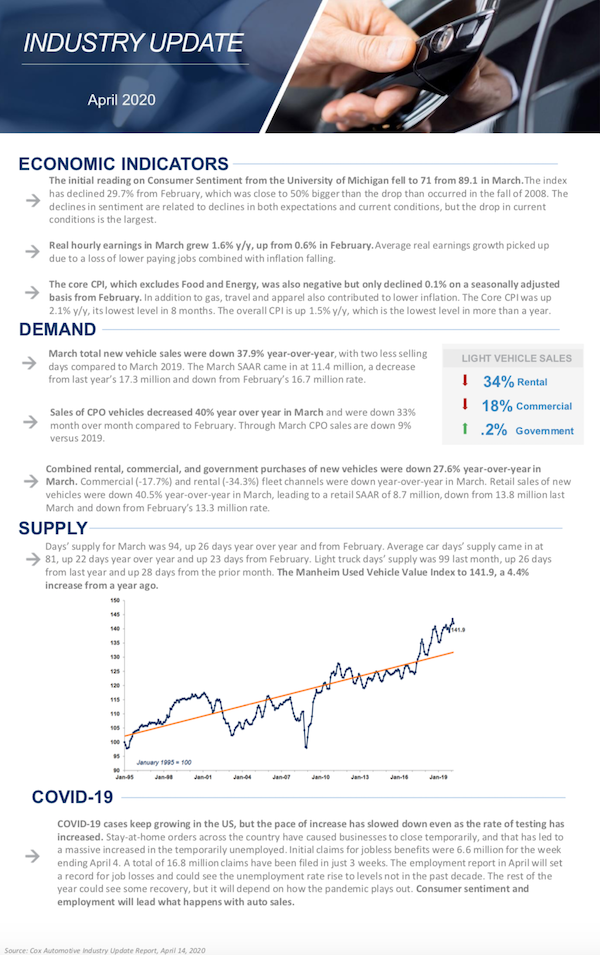
The April 2020 Cox Automotive Industry Update Report shares Cox Automotive’s multifaceted insight into the automotive marketplace to provide an overview of economic indicators, supply, demand, credit and other vital topics and trends affecting the industry.
ECONOMIC INDICATORS
- The initial reading on Consumer Sentiment from the University of Michigan fell to 71 from 89.1 in March. The index has declined 29.7% from February, which was close to 50% bigger than the drop than occurred in the fall of 2008. The declines in sentiment are related to declines in both expectations and current conditions, but the drop in current conditions is the largest.
- Real hourly earnings in March grew 1.6% y/y, up from 0.6% in February. Average real earnings growth picked up due to a loss of lower paying jobs combined with inflation falling.
- The core CPI, which excludes Food and Energy, was also negative but only declined 0.1% on a seasonally adjusted basis from February. In addition to gas, travel and apparel also contributed to lower inflation. The Core CPI was up 2.1% y/y, its lowest level in 8 months. The overall CPI is up 1.5% y/y, which is the lowest level in more than a year.
DEMAND
- March total new vehicle sales were down 37.9% year-over-year, with two less selling days compared to March 2019. The March SAAR came in at 11.4 million, a decrease from last year’s 17.3 million and down from February’s 16.7 million rate.
- Sales of CPO vehicles decreased 40% year over year in March and were down 33% month over month compared to February. Through March CPO sales are down 9% versus 2019.
- Combined rental, commercial, and government purchases of new vehicles were down 27.6% year-over-year in March. Commercial (-17.7%) and rental (-34.3%) fleet channels were down year-over-year in March. Retail sales of new vehicles were down 40.5% year-over-year in March, leading to a retail SAAR of 8.7 million, down from 13.8 million last March and down from February’s 13.3 million rate.
SUPPLY
- Days’ supply for March was 94, up 26 days year over year and from February. Average car days’ supply came in at 81, up 22 days year over year and up 23 days from February. Light truck days’ supply was 99 last month, up 26 days from last year and up 28 days from the prior month. The Manheim Used Vehicle Value Index to 141.9, a 4.4% increase from a year ago.
CREDIT
- COVID-19 cases keep growing in the US, but the pace of increase has slowed down even as the rate of testing has increased. Stay-at-home orders across the country have caused businesses to close temporarily, and that has led to a massive increased in the temporarily unemployed. Initial claims for jobless benefits were 6.6 million for the week ending April 4. A total of 16.8 million claims have been filed in just 3 weeks. The employment report in April will set a record for job losses and could see the unemployment rate rise to levels not in the past decade. The rest of the year could see some recovery, but it will depend on how the pandemic plays out. Consumer sentiment and employment will lead what happens with auto sales.

