Economic outlook
Cox Automotive Industry Update Report: December 2018
Saturday December 22, 2018
Article Highlights
- Economic Indicators: Inflation in November came in as expected. The core CPI, which excludes Food and Energy, increased again 0.2% on a seasonally adjusted basis from October. Housing and specifically rent continues to be the primary factor driving higher core inflation.
- Demand: November new vehicle sales were down 0.7% YOY, with the same number of selling days compared to November 2017. The November SAAR came in at 17.4 million, down versus last year’s 17.5 million. Cars continue to see sharp declines, as sales in November fell 14% compared to last year. The market share for cars fell to 28.8%, which is the lowest monthly share on record. Light trucks outperformed cars in November and were up 6% YOY. New vehicle sales year-to-date are up less than 1% versus last year.
- Supply: The days’ supply for November was 71, up 2 days YOY and down 3 days from October. New vehicle inventories came in under 4 million units for the seventh consecutive month.
The December 2018 Cox Automotive Industry Update Report shares Cox Automotive’s multifaceted insight into the automotive marketplace to provide an overview of economic indicators, supply, demand, credit and other vital topics and trends affecting the industry.
ECONOMIC INDICATORS
- Inflation in November came in as expected. The core CPI, which excludes Food and Energy, increased again 0.2% on a seasonally adjusted basis from October. Housing and specifically rent continues to be the primary factor driving higher core inflation.
- Consumer Confidence, as measured by the Conference Board, fell 1.6% in November to 136 from an 18-year high in October. The consumer’s view of the economy is starting to decline as worries about interest rates and a volatile stock market begin to grow.
DEMAND
- November new vehicle sales were down 0.7% YOY, with the same number of selling days compared to November 2017. The November SAAR came in at 17.4 million, down versus last year’s 17.5 million. Cars continue to see sharp declines, as sales in November fell 14% compared to last year. The market share for cars fell to 28.8%, which is the lowest monthly share on record. Light trucks outperformed cars in November and were up 6% YOY. New vehicle sales year-to-date are up less than 1% versus last year.
- Used vehicle sales volume was up 0.8% YOY in November. The November used SAAR to be 40.1 million, up slightly from 39.8 million last November.
SUPPLY
- The days’ supply for November was 71, up 2 days YOY and down 3 days from October. New vehicle inventories came in under 4 million units for the seventh consecutive month.
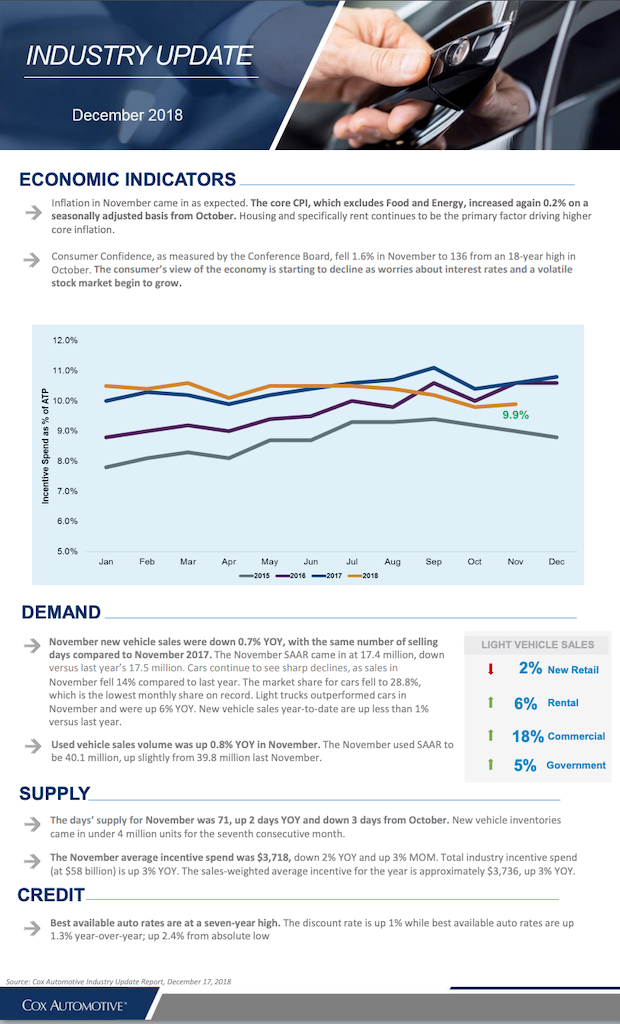
- The November average incentive spend was $3,718, down 2% YOY and up 3% MOM. Total industry incentive spend (at $58 billion) is up 3% YOY. The sales-weighted average incentive for the year is approximately $3,736, up 3% YOY.
CREDIT
- Best available auto rates are at a seven-year high. The discount rate is up 1% while best available auto rates are up 1.3% year-over-year; up 2.4% from absolute low
Source: Cox Automotive Industry Update Report, December 17, 2018