Economic outlook
Cox Automotive Industry Update Report: February 2019
Monday February 25, 2019
Article Highlights
- Economic Indicators: Consumer Credit excluding housing related debt increased in December by $16.6 billion, which was less of an increase than expected and the smallest increase in three months. Credit card balance growth slowed down dramatically, reflecting more cautious spending by consumers at the end of the holiday season.
- Demand: January new vehicle sales were down 2.1% YOY with same number of selling days. The SAAR came in at 16.6 million, down from last year’s 17.1 million. Cars continued to see declines, as sales in January fell 4.8% compared to last year, but even light trucks were down 0.8% YOY
- Supply: Inventory is building up, which suggests incentives should grow in the future. The days’ supply for January was 87, up 27 days from December and up 4 days YOY and the fourth highest level since 2009. Car day’s supply came in 9 days lower than last year, but truck day’s supply was up 10 days. The Manheim Index decreased 1.62% MOM in January. This brought the Index to 135.4, which was a 3.3% increase from a year ago and the lowest level since June.
The February 2019 Cox Automotive Industry Update Report shares Cox Automotive’s multifaceted insight into the automotive marketplace to provide an overview of economic indicators, supply, demand, credit and other vital topics and trends affecting the industry.
ECONOMIC INDICATORS
- Consumer Credit excluding housing related debt increased in December by $16.6 billion, which was less of an increase than expected and the smallest increase in three months. Credit card balance growth slowed down dramatically, reflecting more cautious spending by consumers at the end of the holiday season.
- Unemployment increased again to 4.0% as the government shutdown resulted in an increase in the number of the unemployed on a temporary basis. The underemployment rate, the broadest measure of unemployment, also increased to 8.1%. Beyond the shutdown, unemployment rates have also moved higher as a result of an increase in the labor force participation rate.
DEMAND
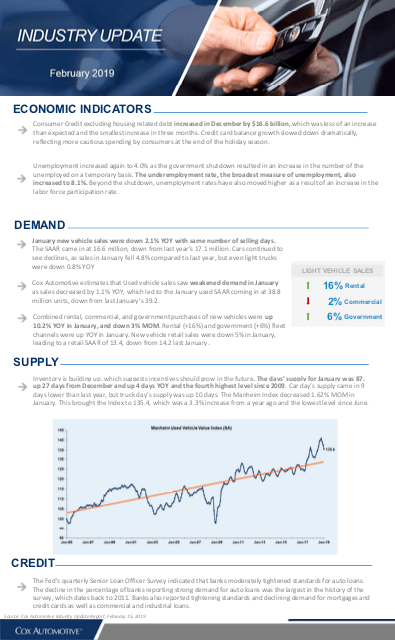
- January new vehicle sales were down 2.1% YOY with same number of selling days. The SAAR came in at 16.6 million, down from last year’s 17.1 million. Cars continued to see declines, as sales in January fell 4.8% compared to last year, but even light trucks were down 0.8% YOY.
- Cox Automotive estimates that Used vehicle sales saw weakened demand in January as sales decreased by 1.1% YOY, which led to the January used SAAR coming in at 38.8 million units, down from last January’s 39.2.
- Combined rental, commercial, and government purchases of new vehicles were up 10.2% YOY in January, and down 3% MOM. Rental (+16%) and government (+6%) fleet channels were up YOY in January. New vehicle retail sales were down 5% in January, leading to a retail SAAR of 13.4, down from 14.2 last January.
SUPPLY
- Inventory is building up, which suggests incentives should grow in the future. The days’ supply for January was 87, up 27 days from December and up 4 days YOY and the fourth highest level since 2009. Car day’s supply came in 9 days lower than last year, but truck day’s supply was up 10 days. The Manheim Index decreased 1.62% MOM in January. This brought the Index to 135.4, which was a 3.3% increase from a year ago and the lowest level since June.
CREDIT
- The Fed’s quarterly Senior Loan Officer Survey indicated that banks moderately tightened standards for auto loans. The decline in the percentage of banks reporting strong demand for auto loans was the largest in the history of the survey, which dates back to 2011. Banks also reported tightening standards and declining demand for mortgages and credit cards as well as commercial and industrial loans.

