Economic outlook
Cox Automotive Industry Update Report: February 2020
Tuesday February 18, 2020
The February 2020 Cox Automotive Industry Update Report shares Cox Automotive’s multifaceted insight into the automotive marketplace to provide an overview of economic indicators, supply, demand, credit and other vital topics and trends affecting the industry.
ECONOMIC INDICATORS
- Consumer Sentiment from the University of Michigan rose to 100.9 in the initial February reading, above the consensus estimate of 99.5 and January’s 99.8. Improvement in expectations is behind the index increase. Consumer expectations are at a 9-month high. According to the consumer sentiment data, buying conditions for vehicles improved in February are better than a year ago.
- Through February 8, tax returns filed with the IRS are down modestly (0.4%), but the number of refunds is down 4.8%. However, the average refund is up slightly (0.2%). We are only about 20% through tax refund season. As we approach 50%, we expect that total refunds will be up over last year along with the average refund amount. At that point we expect the spring used car market to take off and last for 6 to 9 weeks.
DEMAND
- January total new vehicle sales were down 0.2% YOY, with the same number of selling days compared to January 2019. The January SAAR came in at 16.8 million, an increase from last year’s 16.7 million and up from December’s 16.7 million rate.
- Cox Automotive estimates, total used vehicle sales volume was up 2.8% YOY in January, which resulted in a used SAAR of 39.5 million, up from last year but down from December’s 40.0 million rate. CPO sales were up 8% in January versus last year and down 8% from December.
- Combined rental, commercial, and government purchases of new vehicles were down 5.3% YOY in January. Commercial vehicle sales were up 3.7% YOY in January. Retail sales of new vehicles were up 1.0% in January, leading to a retail SAAR of 13.8 million, up from 13.5 million last January and down from December’s 14.2 million rate.
SUPPLY
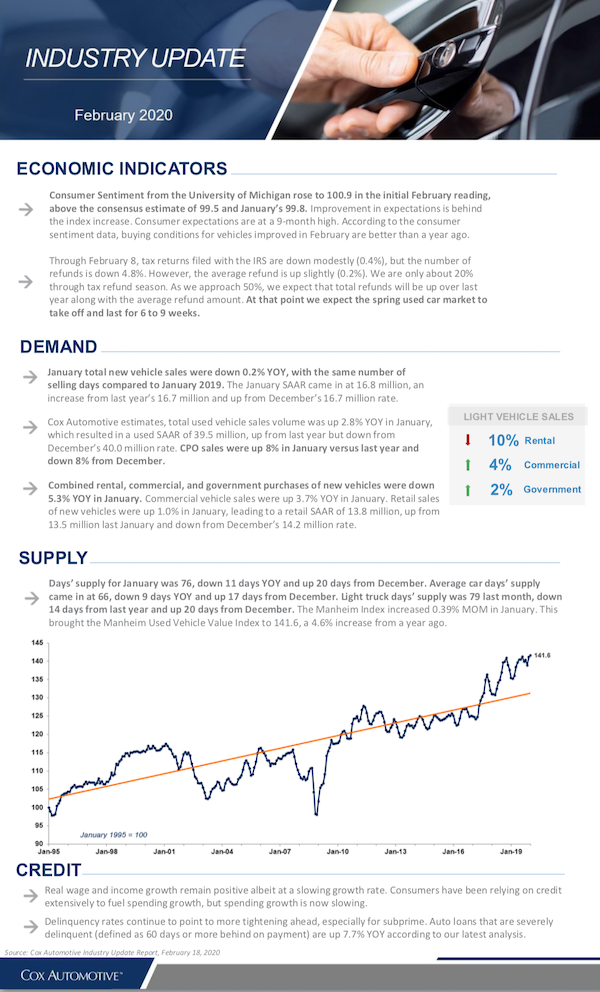
- Days’ supply for January was 76, down 11 days YOY and up 20 days from December. Average car days’ supply came in at 66, down 9 days YOY and up 17 days from December. Light truck days’ supply was 79 last month, down 14 days from last year and up 20 days from December. The Manheim Index increased 0.39% MOM in January. This brought the Manheim Used Vehicle Value Index to 141.6, a 4.6% increase from a year ago.
CREDIT
- Real wage and income growth remain positive albeit at a slowing growth rate. Consumers have been relying on credit extensively to fuel spending growth, but spending growth is now slowing.
- Delinquency rates continue to point to more tightening ahead, especially for subprime. Auto loans that are severely delinquent (defined as 60 days or more behind on payment) are up 7.7% YOY according to our latest analysis.