Economic outlook
Cox Automotive Industry Update Report: July 2019
Wednesday July 17, 2019
Article Highlights
- The U.S. Employment Report for June was stronger than expected as 224,000 jobs were created when analysts had expected 162,000.
- June new vehicle sales were down 2% YOY, with one less selling day as June 2018.
- Days’ supply for June was 67, down 1 day YOY and up 3 days from May. Average car days’ supply came in at 56 which was down 7 days YOY and up 2 days from May. Light truck days’ supply was 72 last month, up 2 days from last year and up 4 days from May.
The July 2019 Cox Automotive Industry Update Report shares Cox Automotive’s multifaceted insight into the automotive marketplace to provide an overview of economic indicators, supply, demand, credit and other vital topics and trends affecting the industry.
ECONOMIC INDICATORS
- The U.S. Employment Report for June was stronger than expected as 224,000 jobs were created when analysts had expected 162,000. The prior two monthly numbers were revised down for a net loss of 11,000 jobs than originally estimated. Even with the strong bounce-back in June from the very low 72,000 jobs in May, average monthly job creation year to date of 172k continues to show that job creation is slowing compared to 2018 (223k) and 2017 (179k).
- June saw an increase in the unemployment rate, which moved up to 3.7 %. The underemployment rate also increased one-tenth of a point to 7.1%. The increases in the unemployment rates were a result of an increase in the labor force as the labor force participation rate increased to 62.9%.
DEMAND
- June new vehicle sales were down 2% YOY, with one less selling day as June 2018. The June SAAR came in at 17.3 million, improving versus last year’s 17.2 million but down from May’s 17.4 million rate.
- Cox Automotive estimates that used vehicle sales saw weakness in June as sales decreased by 3% YOY, which led to the June used SAAR coming in at 39.8 million units, down from last June’s 41.1 million.
- Combined rental, commercial, and government purchases of new vehicles were up 5% y/y in June, and down 11% m/m. The rental (+11%) fleet channel was up y/y in June. New vehicle retail sales were down 3% in June, leading to a retail SAAR of 14.1 million, down from 14.3 million last June.
SUPPLY
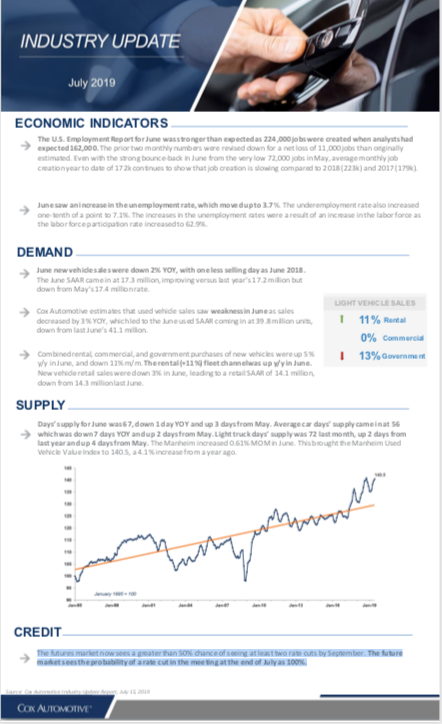
- Days’ supply for June was 67, down 1 day YOY and up 3 days from May. Average car days’ supply came in at 56 which was down 7 days YOY and up 2 days from May. Light truck days’ supply was 72 last month, up 2 days from last year and up 4 days from May. The Manheim increased 0.61% MOM in June. This brought the Manheim Used Vehicle Value Index to 140.5, a 4.1% increase from a year ago.
CREDIT
- The futures market now sees a greater than 50% chance of seeing at least two rate cuts by September. The future market sees the probability of a rate cut in the meeting at the end of July as 100%.