Economic outlook
Cox Automotive Industry Update Report: March 2019
Friday March 15, 2019
Article Highlights
- Economic Indicators: The pace of new home sales improved in December after large downward revisions were made to October and November sales. New home sales in 2018 increased 1.5% while existing home sales declined by 3.1%. Housing subtracted from economic growth in 2018 due to affordability and supply challenges. New construction data for January points to a more encouraging trend. Starts increased 18.6% for the month. Permits also increased by 1.5%, and permits remain higher than starts, which indicates more starts in coming months. We are not likely to see stable new construction in 2019.
- Demand: February new vehicle sales were down 2.4% YOY, with the same number of selling days compared to February 2018. The February SAAR came in at 16.5 million, down versus last year’s 16.9 million. Cars continue to see declines, as sales in February fell 10.6% compared to last year.
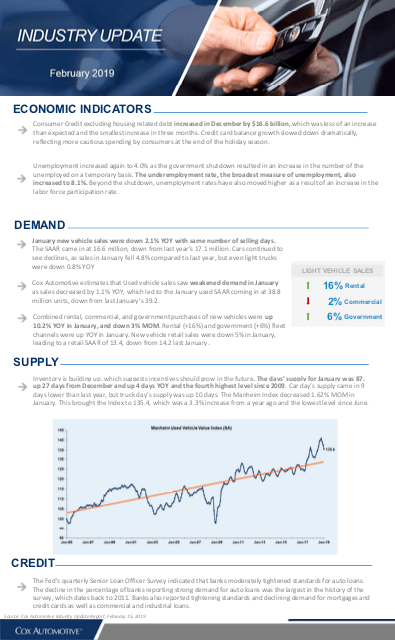
- Supply: Inventory is building up, which suggests incentives should grow in the future. The days’ supply for February was 77, up 4 days YOY and down 10 days from January. Average car day’s supply came in at 69 which was down 2 days YOY and down 6 days from January. Light truck day’s supply was 80 last month, up 6 days from last year and down 13 days from January. The Manheim Index decreased 0.11% MOM in February. This brought the Index to 135.2, which was a 3.2% increase from a year ago.
The March 2019 Cox Automotive Industry Update Report shares Cox Automotive’s multifaceted insight into the automotive marketplace to provide an overview of economic indicators, supply, demand, credit and other vital topics and trends affecting the industry.
ECONOMIC INDICATORS
- The pace of new home sales improved in December after large downward revisions were made to October and November sales. New home sales in 2018 increased 1.5% while existing home sales declined by 3.1%. Housing subtracted from economic growth in 2018 due to affordability and supply challenges. New construction data for January points to a more encouraging trend. Starts increased 18.6% for the month. Permits also increased by 1.5%, and permits remain higher than starts, which indicates more starts in coming months. We are not likely to see stable new construction in 2019.
- Unemployment declined to 3.8%, and the underemployment rate, the broadest measure of unemployment, plunged to 7.3%, which was an 18-year low. The YOY change in average hourly earnings accelerated to 3.4% YOY, which is the highest level of wage inflation since 2009.
DEMAND
- February new vehicle sales were down 2.4% YOY, with the same number of selling days compared to February 2018. The February SAAR came in at 16.5 million, down versus last year’s 16.9 million. Cars continue to see declines, as sales in February fell 10.6% compared to last year.
- Cox Automotive estimates that used vehicle sales saw strengthened demand in February as sales increased by 2% YOY, which led to the February used SAAR coming in at 39.4 million units, up from last February’s 38.6 million.
- Combined rental, commercial, and government purchases of new vehicles were up 3.5% YOY in February, and up 26% MOM. Rental (+5%) and government (+2%) fleet channels were up YOY in February. New vehicle retail sales were down 4% in February, leading to a retail SAAR of 13.0, down from 13.5 last February.
SUPPLY
- Inventory is building up, which suggests incentives should grow in the future. The days’ supply for February was 77, up 4 days YOY and down 10 days from January. Average car day’s supply came in at 69 which was down 2 days YOY and down 6 days from January. Light truck day’s supply was 80 last month, up 6 days from last year and down 13 days from January. The Manheim Index decreased 0.11% MOM in February. This brought the Index to 135.2, which was a 3.2% increase from a year ago.
CREDIT
- The Fed’s quarterly Senior Loan Officer Survey indicated that banks moderately tightened standards for auto loans. The decline in the percentage of banks reporting strong demand for auto loans was the largest in the history of the survey, which dates back to 2011. Banks also reported tightening standards and declining demand for mortgages and credit cards as well as commercial and industrial loans.