Economic outlook
Cox Automotive Industry Update Report: November 2019
Friday November 15, 2019
The November 2019 Cox Automotive Industry Update Report shares Cox Automotive’s multifaceted insight into the automotive marketplace to provide an overview of economic indicators, supply, demand, credit and other vital topics and trends affecting the industry.
ECONOMIC INDICATORS
- Headline unemployment rate came in at 3.6% in October. The October employment report provided evidence of a slower but stabilizing economy. Job creation slowed to 128,000 when analysts had expected only 85,000, and the prior two monthly numbers were revised up for a net increase of 95,000 more jobs than originally estimated.
- The first estimate of third quarter real GDP growth came in at 1.9% and continued the streak of declining growth observed each quarter this year. Consumer spending again drove the economy with a 2.9% increase, which accounted for nearly all of the growth.
DEMAND
- October total new vehicle sales were down 1.8% YOY , with one more selling day compared to October 2018. The October SAAR came in at 16.5 million, a decline from last year’s 17.5 million and also down from September’s 17.1 million rate.
- Cox Automotive estimates that used vehicle sales increased 1.4% YOY in October, which resulted in a used SAAR of 39.6 million, up from last year but down slightly from last month. CPO sales were up 8% in October versus last year and are up 3% YTD.
- Combined rental, commercial, and government purchases of new vehicles were down 10.8% YOY in October. The commercial fleet channel was particularly strong, up 17% YOY last month. Retail sales of new vehicles were down 0.2% in October, leading to a retail SAAR of 14.3 million, down from 14.9 million last October and the weakest retail SAAR over the last four months.
SUPPLY
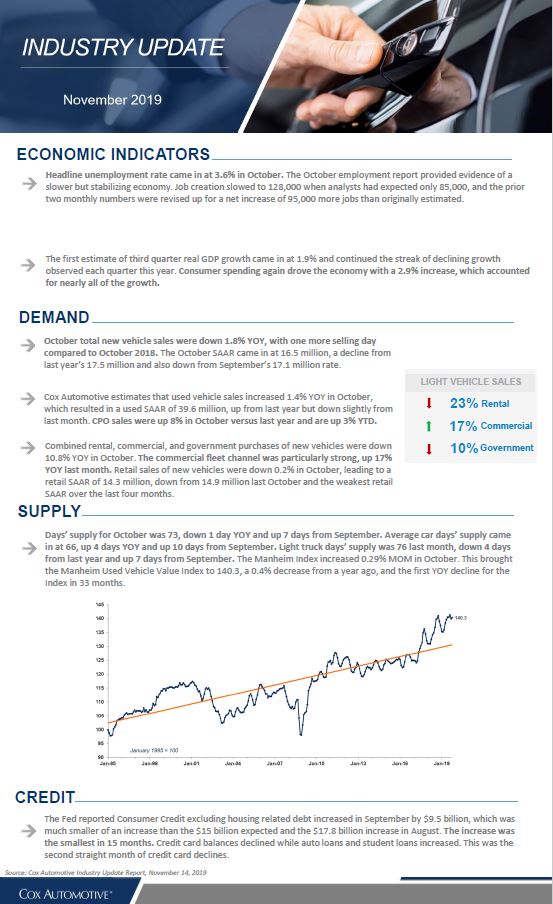
- Days’ supply for October was 73, down 1 day YOY and up 7 days from September. Average car days’ supply came in at 66, up 4 days YOY and up 10 days from September. Light truck days’ supply was 76 last month, down 4 days from last year and up 7 days from September. The Manheim Index increased 0.29% MOM in Octobe r . This brought the Manheim Used Vehicle Value Index to 140.3, a 0.4% decrease from a year ago, and the first YOY decline for the Index in 33 months.
CREDIT
- The Fed reported Consumer Credit excluding housing related debt increased in September by $9.5 billion, which was much smaller of an increase than the $15 billion expected and the $17.8 billion increase in August. The increase was the smallest in 15 months. Credit card balances declined while auto loans and student loans increased. This was the second straight month of credit card declines.