Economic outlook
Cox Automotive Industry Update Report: September 2019
Thursday September 19, 2019
Article Highlights
- Job creation slowed to 130,000 when analysts had expected 160,000. The prior two monthly numbers were revised down for a net decrease of 20,000 fewer jobs than originally estimated. With the revisions, the average monthly job creation YTD of 158k continues to drop compared to the brisk 223k pace last year. The headline unemployment rate remained at 3.7%. The underemployment rate increased to 7.2% from the 18-year low of 7.0% in July
- August new vehicle sales were up 11% YOY, with one more selling day compared to August 2018. The August SAAR came in at 17 million, improving versus last year’s 16.9 million and up from July’s 16.8 million rate.
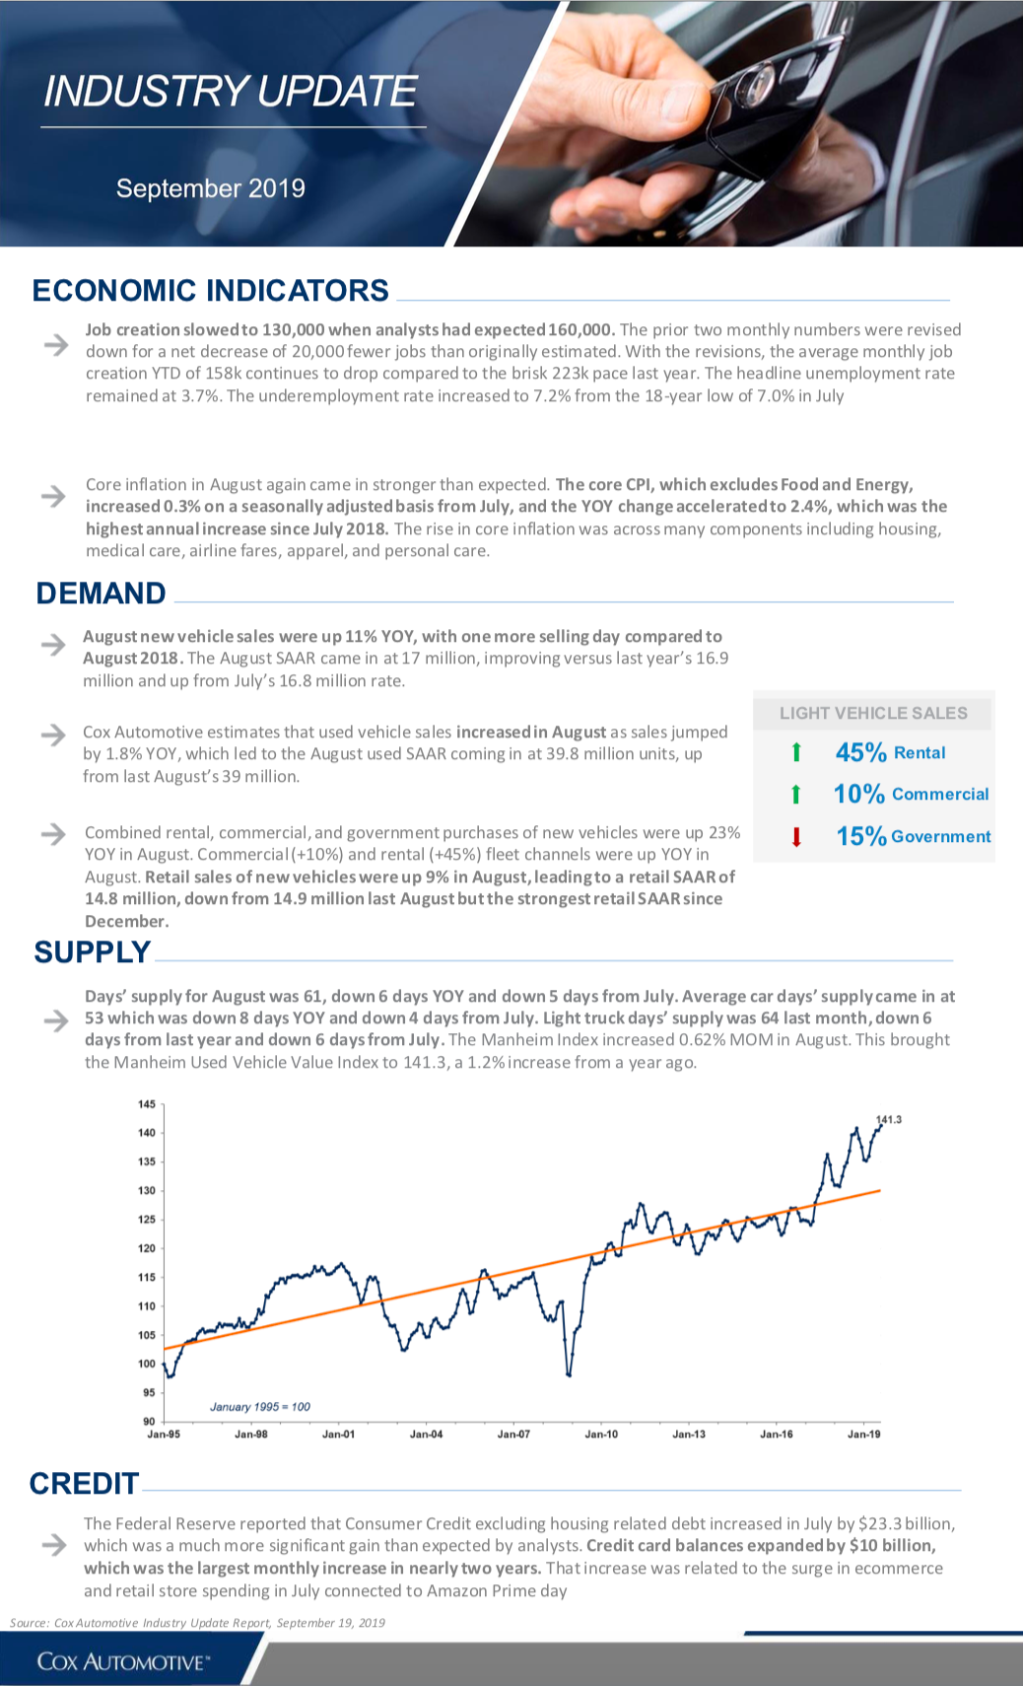
- Days’ supply for August was 61, down 6 days YOY and down 5 days from July. Average car days’ supply came in at 53 which was down 8 days YOY and down 4 days from July. Light truck days’ supply was 64 last month, down 6 days from last year and down 6 days from July. The Manheim Index increased 0.62% MOM in August. This brought the Manheim Used Vehicle Value Index to 141.3, a 1.2% increase from a year ago.
The September 2019 Cox Automotive Industry Update Report shares Cox Automotive’s multifaceted insight into the automotive marketplace to provide an overview of economic indicators, supply, demand, credit and other vital topics and trends affecting the industry.
ECONOMIC INDICATORS
- Job creation slowed to 130,000 when analysts had expected 160,000. The prior two monthly numbers were revised down for a net decrease of 20,000 fewer jobs than originally estimated. With the revisions, the average monthly job creation YTD of 158k continues to drop compared to the brisk 223k pace last year. The headline unemployment rate remained at 3.7%. The underemployment rate increased to 7.2% from the 18-year low of 7.0% in July
- Core inflation in August again came in stronger than expected. The core CPI, which excludes Food and Energy, increased 0.3% on a seasonally adjusted basis from July, and the YOY change accelerated to 2.4%, which was the highest annual increase since July 2018. The rise in core inflation was across many components including housing, medical care, airline fares, apparel, and personal care.
DEMAND
- August new vehicle sales were up 11% YOY, with one more selling day compared to August 2018. The August SAAR came in at 17 million, improving versus last year’s 16.9 million and up from July’s 16.8 million rate.
- Cox Automotive estimates that used vehicle sales increased in August as sales jumped by 1.8% YOY, which led to the August used SAAR coming in at 39.8 million units, up from last August’s 39 million.
- Combined rental, commercial, and government purchases of new vehicles were up 23% YOY in August. Commercial (+10%) and rental (+45%) fleet channels were up YOY in August. Retail sales of new vehicles were up 9% in August, leading to a retail SAAR of 14.8 million, down from 14.9 million last August but the strongest retail SAAR since December.
SUPPLY
- Days’ supply for August was 61, down 6 days YOY and down 5 days from July. Average car days’ supply came in at 53 which was down 8 days YOY and down 4 days from July. Light truck days’ supply was 64 last month, down 6 days from last year and down 6 days from July. The Manheim Index increased 0.62% MOM in August. This brought the Manheim Used Vehicle Value Index to 141.3, a 1.2% increase from a year ago.
CREDIT
- The Federal Reserve reported that Consumer Credit excluding housing related debt increased in July by $23.3 billion, which was a much more significant gain than expected by analysts. Credit card balances expanded by $10 billion, which was the largest monthly increase in nearly two years. That increase was related to the surge in ecommerce and retail store spending in July connected to Amazon Prime day