Smoke on Cars
Auto Market Weekly Summary
Monday February 11, 2019
While January is a tough month to judge exactly where the economy and vehicle sales will go for the full year, the month was rocky, and we do expect the year to be rocky as well.
Last week’s recap: New- and used-vehicle sales were impacted by frigid temperatures in much of the country during the final week of the month. Declining demand for auto loans reported by banks was clearly reflected in weak sales of both new and used vehicles. The government shutdown likely hurt areas with large numbers of government employees and contractors. Plus, consumers had no compelling reasons to buy with rates slightly higher and incentives much lower.
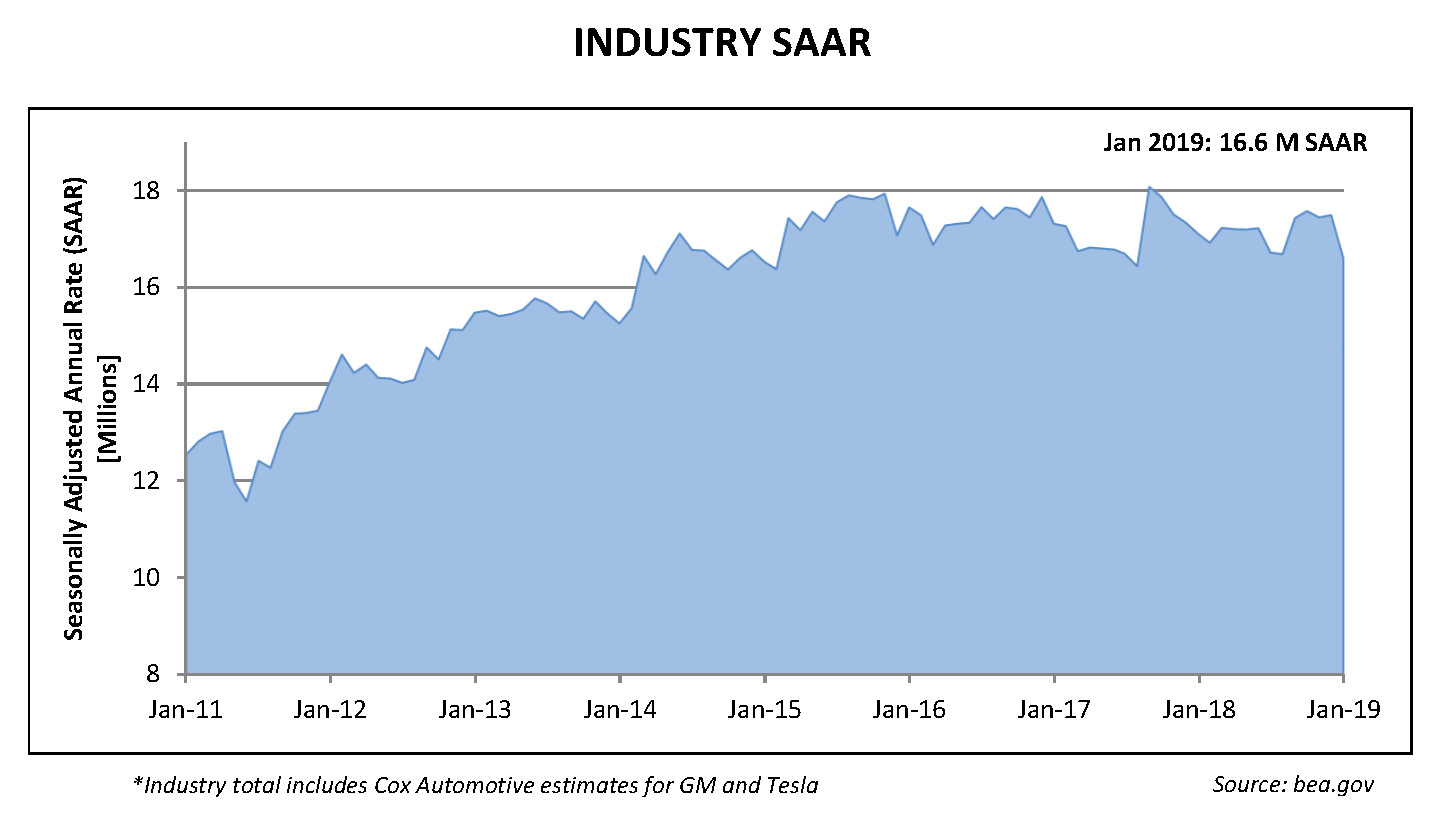
January new-vehicle sales: January new vehicle sales were down 2.1 percent from a year ago with same number of selling days. The SAAR came in at 16.6 million, down from last January’s 17.1 million. Cars continued to see declines, as sales in January fell 4.8 percent compared with last year, but even light trucks were down 0.8 percent from a year ago.

Had it not been for a 10.2-percent increase in fleet purchases in January from the year before, new vehicle sales would have been down even more. The new retail SAAR was 13.4 million, down from January 2018’s 14.2 million and the lowest retail new-vehicle SAAR since March 2016. January is not the best indicator for the full year as it always ranks near the bottom of months for both new and used sales. That said, January was clearly a rough start to the year.
Auto loan demand wanes: Further indication of weakening vehicle sales is the fact that consumers slowed down their pace of borrowing in December even while vehicle sales remained strong. Banks are reporting declining demand for auto loans this quarter, and that decline was clearly evident in weak sales of both new and used vehicles in January.
January incentives: Buyers were likely disappointed by incentives in January, which were down 8 percent from December and down 6 percent from the year-ago January. In terms of incentives, consumers had no reason to brave the polar vortex to buy a vehicle at month end. They can look for better deals ahead.
Inventories rise, incentives may follow: Inventories are building, suggesting incentives should grow in the future. The days’ supply for January was 87, up 27 days from December and up four days from a year ago, the fourth highest level since 2009. Car day’s supply came in nine days lower than last year, but truck day’s supply was up 10 days.
January used vehicle sales, prices: Initial estimates suggest the used vehicle market also saw weakened demand in January as sales decreased by 1.1 percent from a year ago, which led to the January used SAAR coming in at 38.8 million units, down from last January’s 39.2. The Manheim Index decreased 1.62 percent from December to January. This brought the Index to 135.4, which was a 3.3-percent increase from a year ago and the lowest level since June.
On a year-over-year basis, midsize and compact cars again outperformed the overall market. All other major segments underperformed the market, and luxury cars saw slight price declines year-over-year. Dealers are being conservative about building used car inventories, but lower wholesale prices should help stimulate more used car sales as the year progresses.
Looking ahead: We expect more belated government data from December and January consumer prices and inflation. The clock is also ticking for the White House to release the Commerce Department report on the national defense grounds for the Section 232 tariff on imported autos and parts. If not next week, we’ll definitely know more by February 19. All eyes will be on Washington for possibly another government shutdown.
