Data Point
Cox Automotive’s Xtime Launches New Metrics To Track Service Department Activity
Wednesday October 20, 2021
In recent months, U.S. auto dealership profitability has soared. In fact, according to the Q3 2021 Cox Automotive Dealership Sentiment Index, franchised dealer profitability has never been higher, driven largely by strong demand and tight inventory of both new and used vehicles. In many cases, new vehicles have been selling at or above manufacturer’s suggested retail price (MSRP). Sales incentives are low as well.
Revenue from vehicle sales, however, is just one part of a dealership’s overall profitability picture. A healthy service department is equally important. National Automobile Dealers Association data indicate that fixed ops (service, parts and body shop) represent 51% of the average franchised dealer’s total gross profit.
To provide a general look at service department activity over time, Cox Automotive has turned to its colleagues at Xtime, makers of end-to-end software solutions that help dealers deliver the ultimate service experience. Importantly, the Xtime team facilitates more than 10 million service appointments monthly.
From this flow of service department data, and working with the data scientists at Cox Automotive, the Xtime team developed two new metrics to quantify average service department performance over time, with the information indexed to January 2019.
The top-line measures are 1) the number of repair orders (ROs) each month and 2) the revenue from each RO. These two measures — RO Volume and RO Revenue — provide a glimpse into service department performance at franchised dealerships in the U.S.
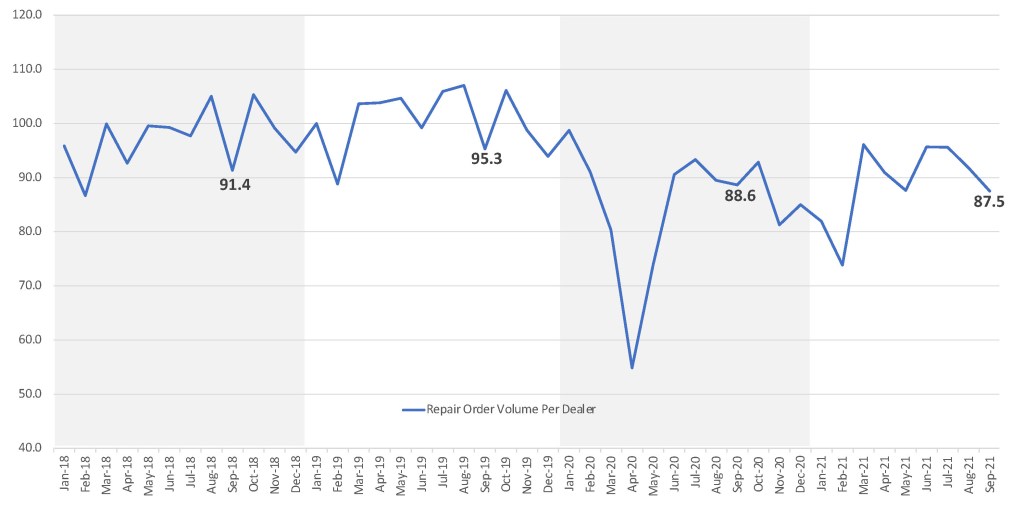
As the first graph shows, average per dealer RO Volume has not fully recovered from the major drop in the spring of 2020 when the global COVID-19 pandemic hit the U.S. market and shut down many dealer operations.
Xtime Repair Order Volume Index

In September, the RO Volume Index was at 87.5, down 1.3% from September 2020 and down 8.2% from September 2019. The volume index in September was also down 4.7% month over month from August. Worth noting: Service volume consistently slows in September, after busier summer months.
The average revenue per repair order, on the other hand, has grown significantly from pre-pandemic levels, as illustrated in the second graph. At 116.3 in September, the RO Revenue Index was 5.9% higher than September 2020 and up 1.0% percent from August.
Xtime Repair Order Revenue Index

The Revenue Index last month was also up 18% from September 2019 and at an all-time high in the data set. The previous high, at 116, was set in April 2021. The overall trend line indicates revenue per repair order has taken a step change since the COVID-19 pandemic hit the auto industry. Each repair order generates more than $450 in revenue on average.
Cox Automotive Industry Insights, with help from the Xtime data team, will report the RO Volume Index and RO Revenue Index around the 20th of each month. For more information, reach out to the Cox Automotive Public Relations team.
Xtime is the leading end-to-end software solution that drives customer loyalty and revenue for automotive dealers in each stage of the service process. With easy-to-use technology and industry experts, Xtime helps dealers meet changing customer expectations. As an advanced, connected solution that provides exceptional support, Xtime is committed to helping dealers deliver the ultimate service experience. Through transparency, convenience, and trust, Xtime Spectrum — comprised of Schedule, Engage, Inspect, and Invite — facilitates more than ten million service appointments monthly. Xtime is a Cox Automotive™ brand.
