Data Point
Dealership Service Activity Increases in October, according to Xtime Metrics
Friday November 19, 2021
Service centers at U.S. franchised dealerships were generally busier in October than in September, according to the latest analysis of Xtime metrics. Both the Repair Order Volume Index and Repair Order Revenue Index increased in October versus September, although the repair order volume continues to be below pre-pandemic levels. Revenue per repair reached a record high.
The monthly Xtime volume and revenue metrics have been created to showcase average service department performance over time, with the information indexed to January 2019. The two, top-line measures provide a glimpse into service department performance at franchised dealerships in the U.S. Xtime provides software that helps auto dealers facilitate more than ten million service appointments monthly.
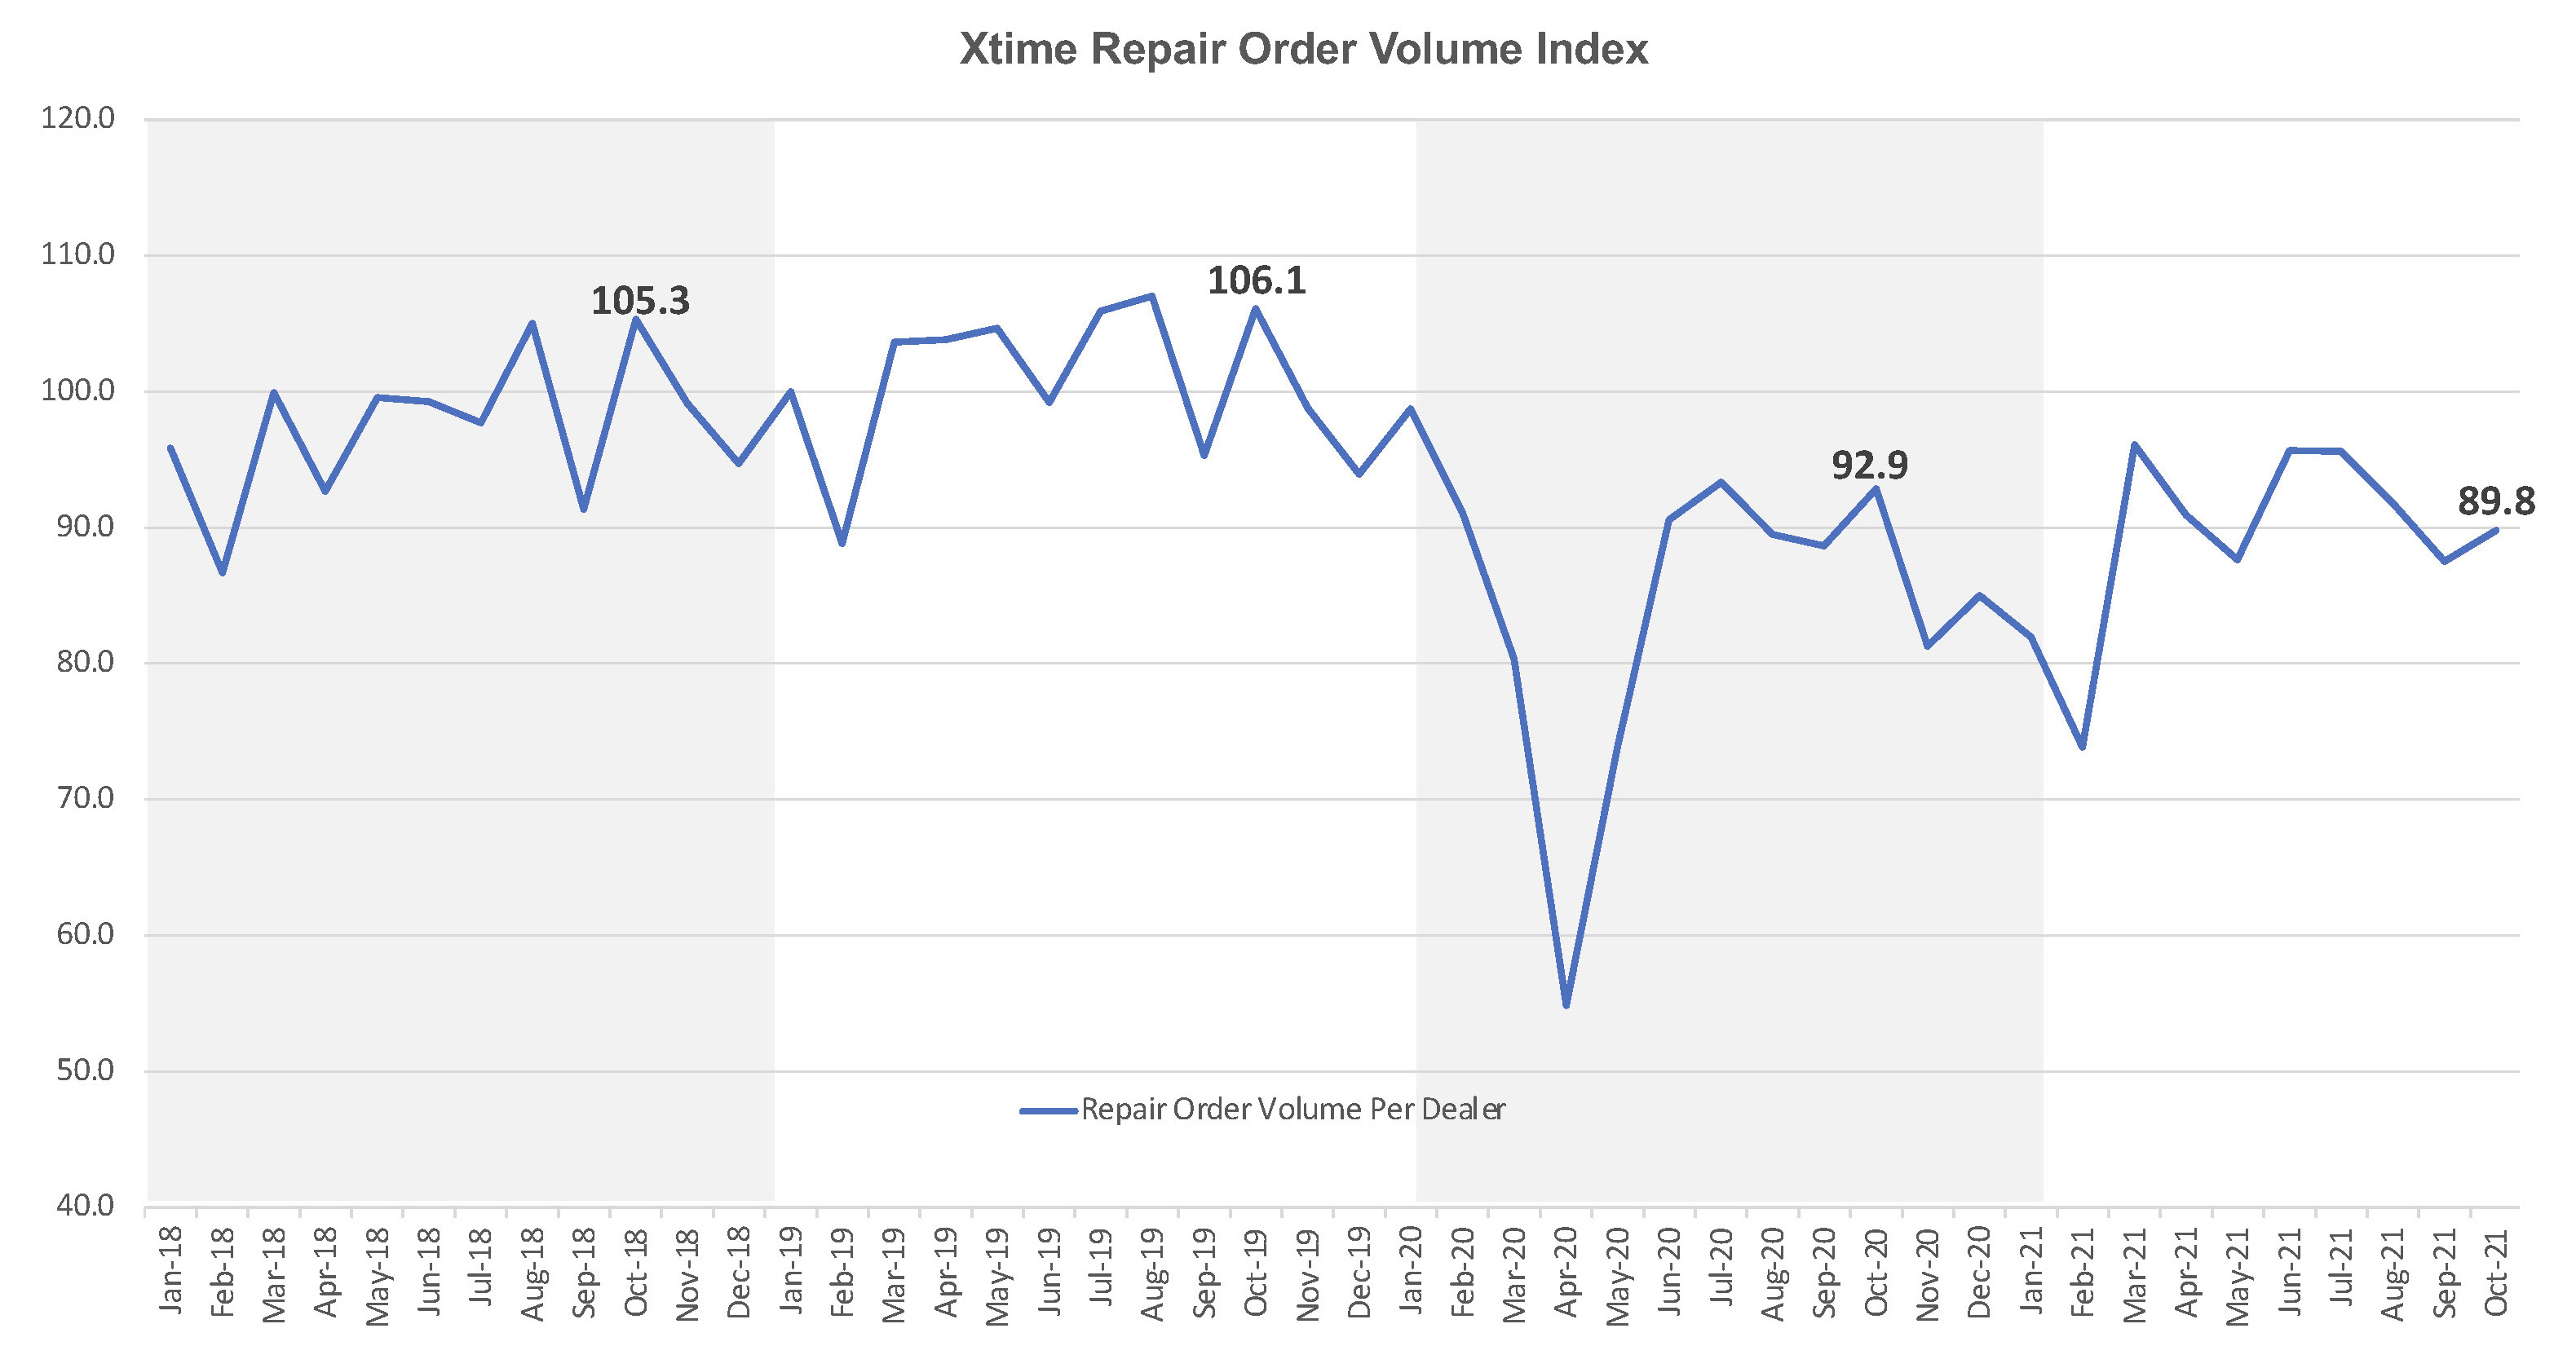
In October, the Repair Order Volume Index was up 2.6% month over month from September, at 89.9, but remained down 3.3% from October 2020 and down 15.3% from October 2019.
While higher month over month, the overall volume of repair orders being processed at U.S. franchised dealerships continues to be lower compared to the months prior to the onset of the global pandemic. Recent research from Cox Automotive indicates many consumers continue to delay or put off having their vehicles serviced, although this number is down significantly from the height of the pandemic. Lately, owners are delaying service more because of concerns over the costs, less due to fewer-than-normal miles being driven.
Xtime Repair Order Volume Index
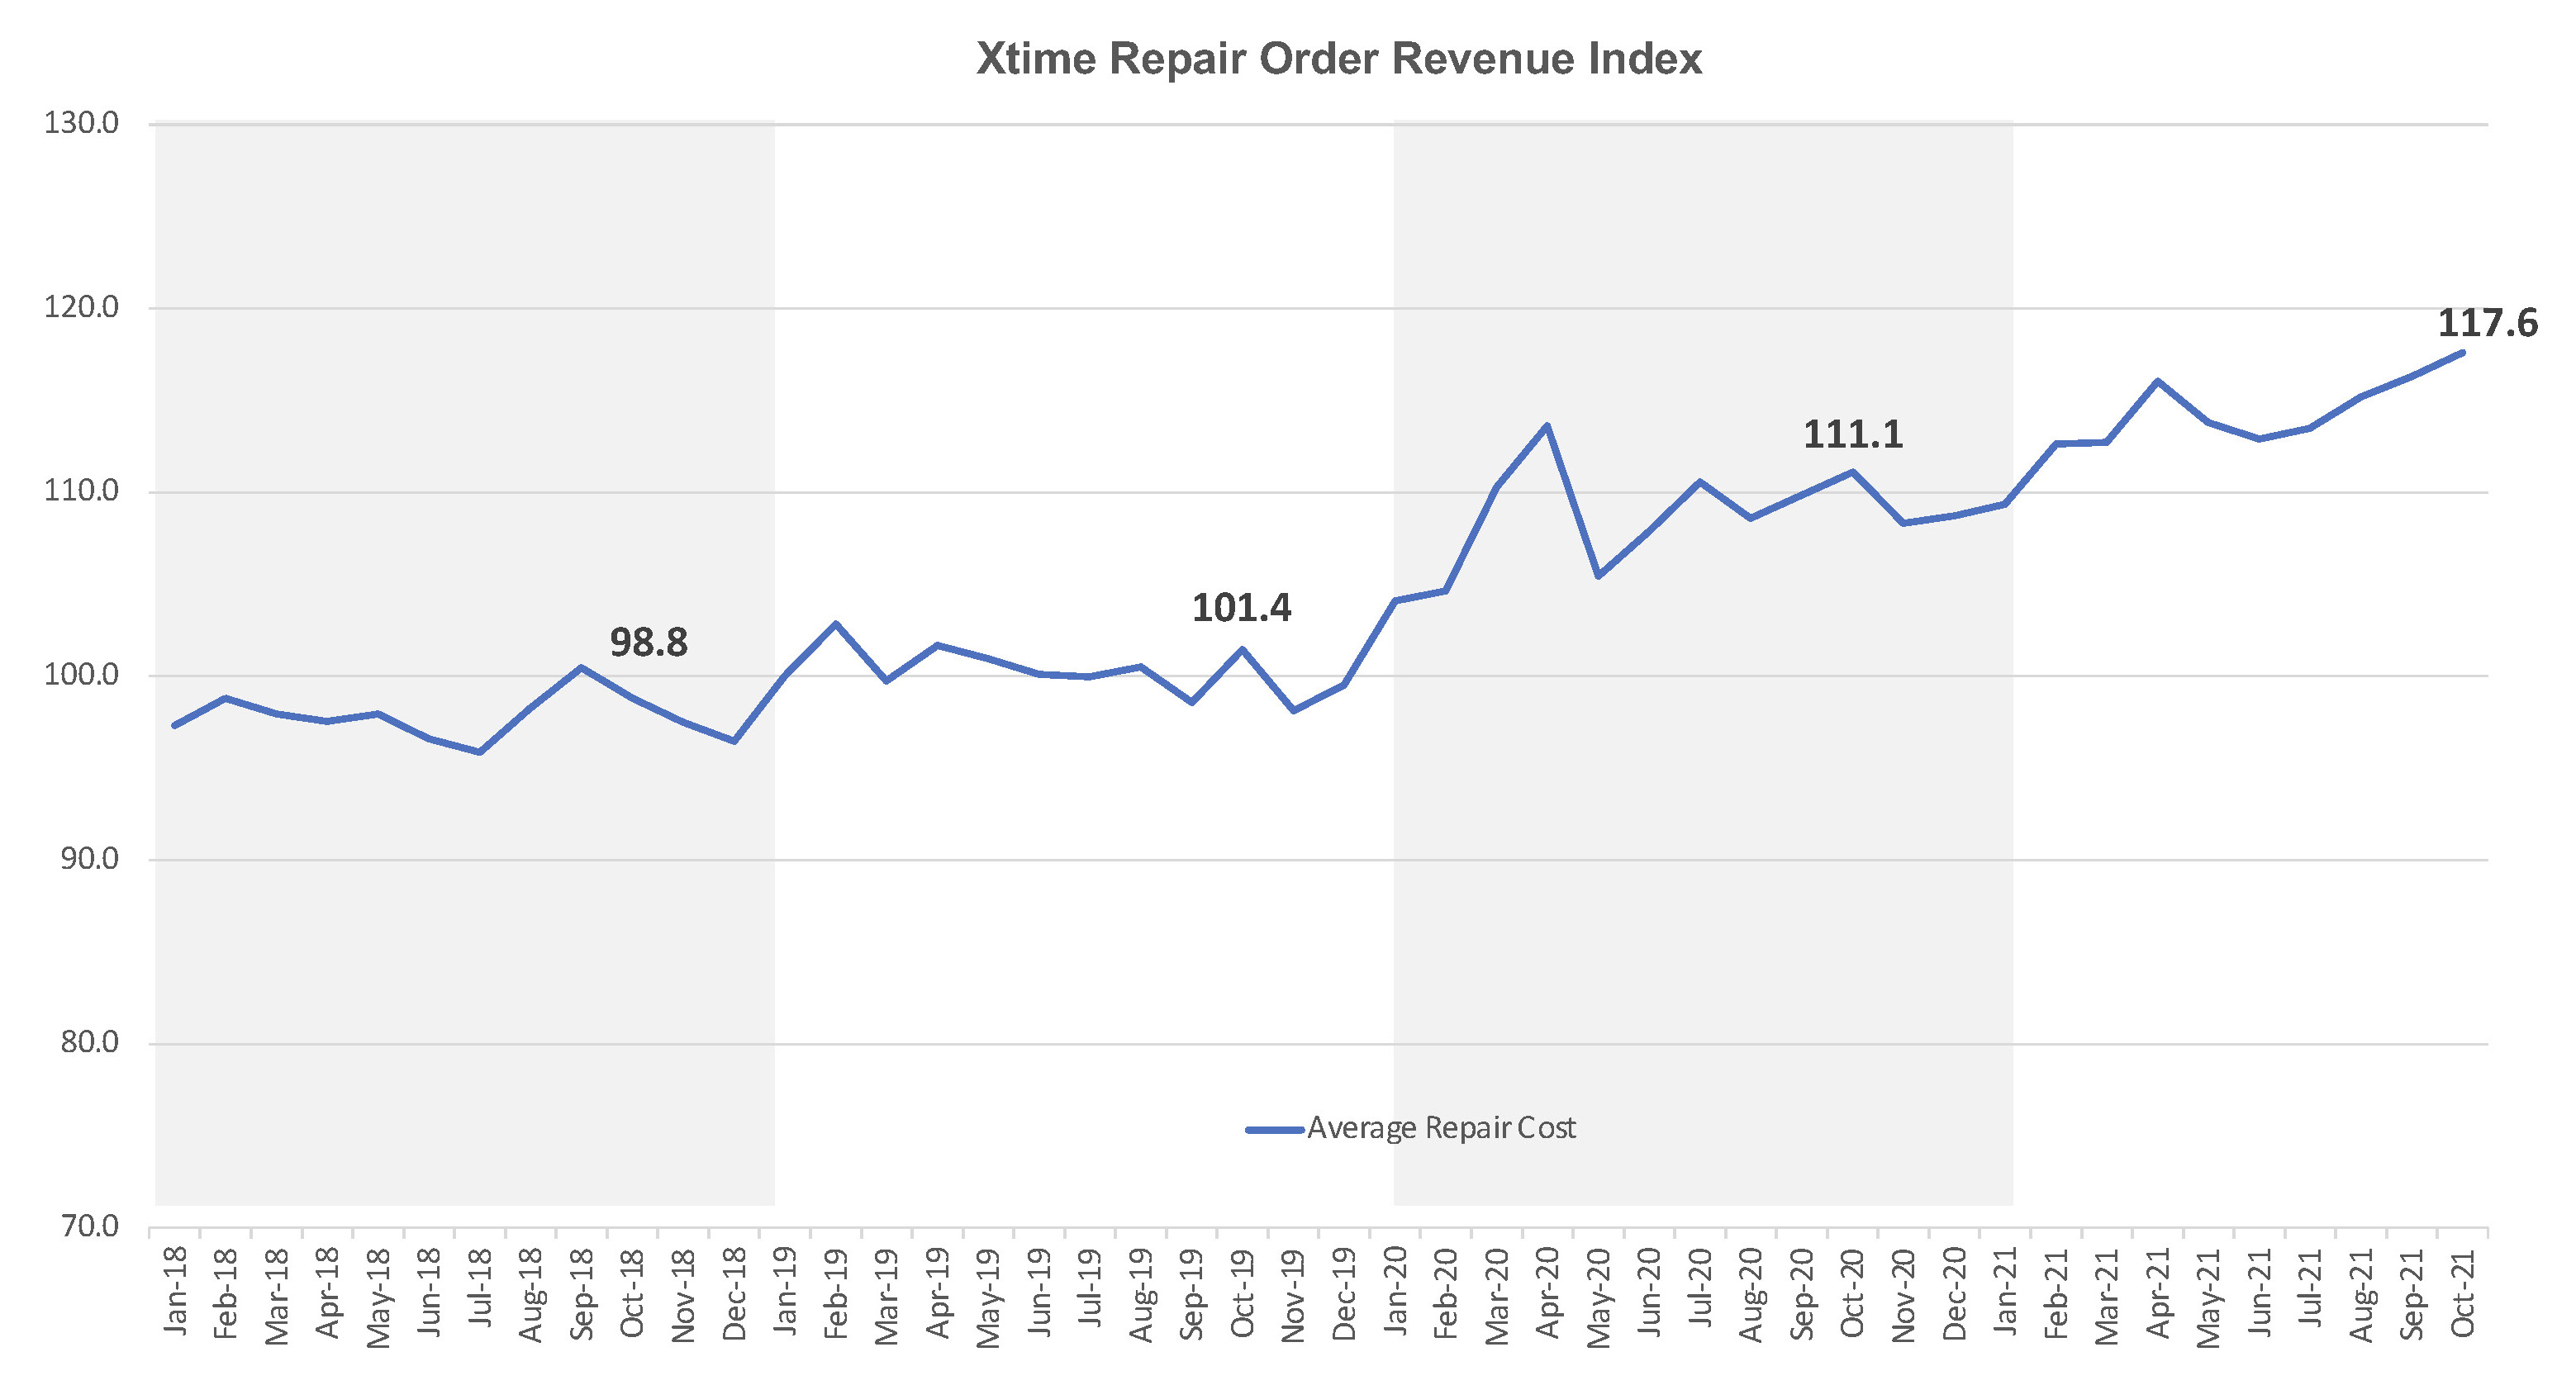
The average revenue generated per repair order hit a new record in October. The previous high, at 116.3, was set in September 2021. At 117.6, the Repair Order Revenue Index in October was 5.9% higher than October 2020 and up 1.1% percent from September. The Revenue Index last month was also up 16% from October 2019.
The overall trend line indicates revenue per repair order has taken a step change since the COVID-19 pandemic hit the auto industry. Each repair order generates more than $450 in revenue on average.
Xtime Repair Order Revenue Index
Cox Automotive Industry Insights, with help from the Xtime data team, will report the Repair Order Volume Index and Repair Order Revenue Index around the 20th of each month. For more information, reach out to the Cox Automotive Public Relations team.
Xtime is the leading end-to-end software solution that drives customer loyalty and revenue for automotive dealers in each stage of the service process. With easy-to-use technology and industry experts, Xtime helps dealers meet changing customer expectations. As an advanced, connected solution that provides exceptional support, Xtime is committed to helping dealers deliver the ultimate service experience. Through transparency, convenience, and trust, Xtime Spectrum — comprised of Schedule, Engage, Inspect, and Invite — facilitates more than ten million service appointments monthly. Xtime is a Cox Automotive™ brand.