
Service centers at U.S. franchised dealerships were less busy in January than in December, according to the latest analysis of Xtime metrics. The Repair Order Volume Index decreased month over month while the Repair Order Revenue Index increased. Repair order volume remains well below pre-pandemic levels, but revenue per repair set another record high.
The monthly Xtime volume and revenue metrics are designed to showcase average service department performance over time, with the information indexed to January 2019. The two, top-line measures provide a glimpse into service department performance at franchised dealerships in the U.S. Xtime provides software that helps auto dealers facilitate more than 10 million service appointments monthly.
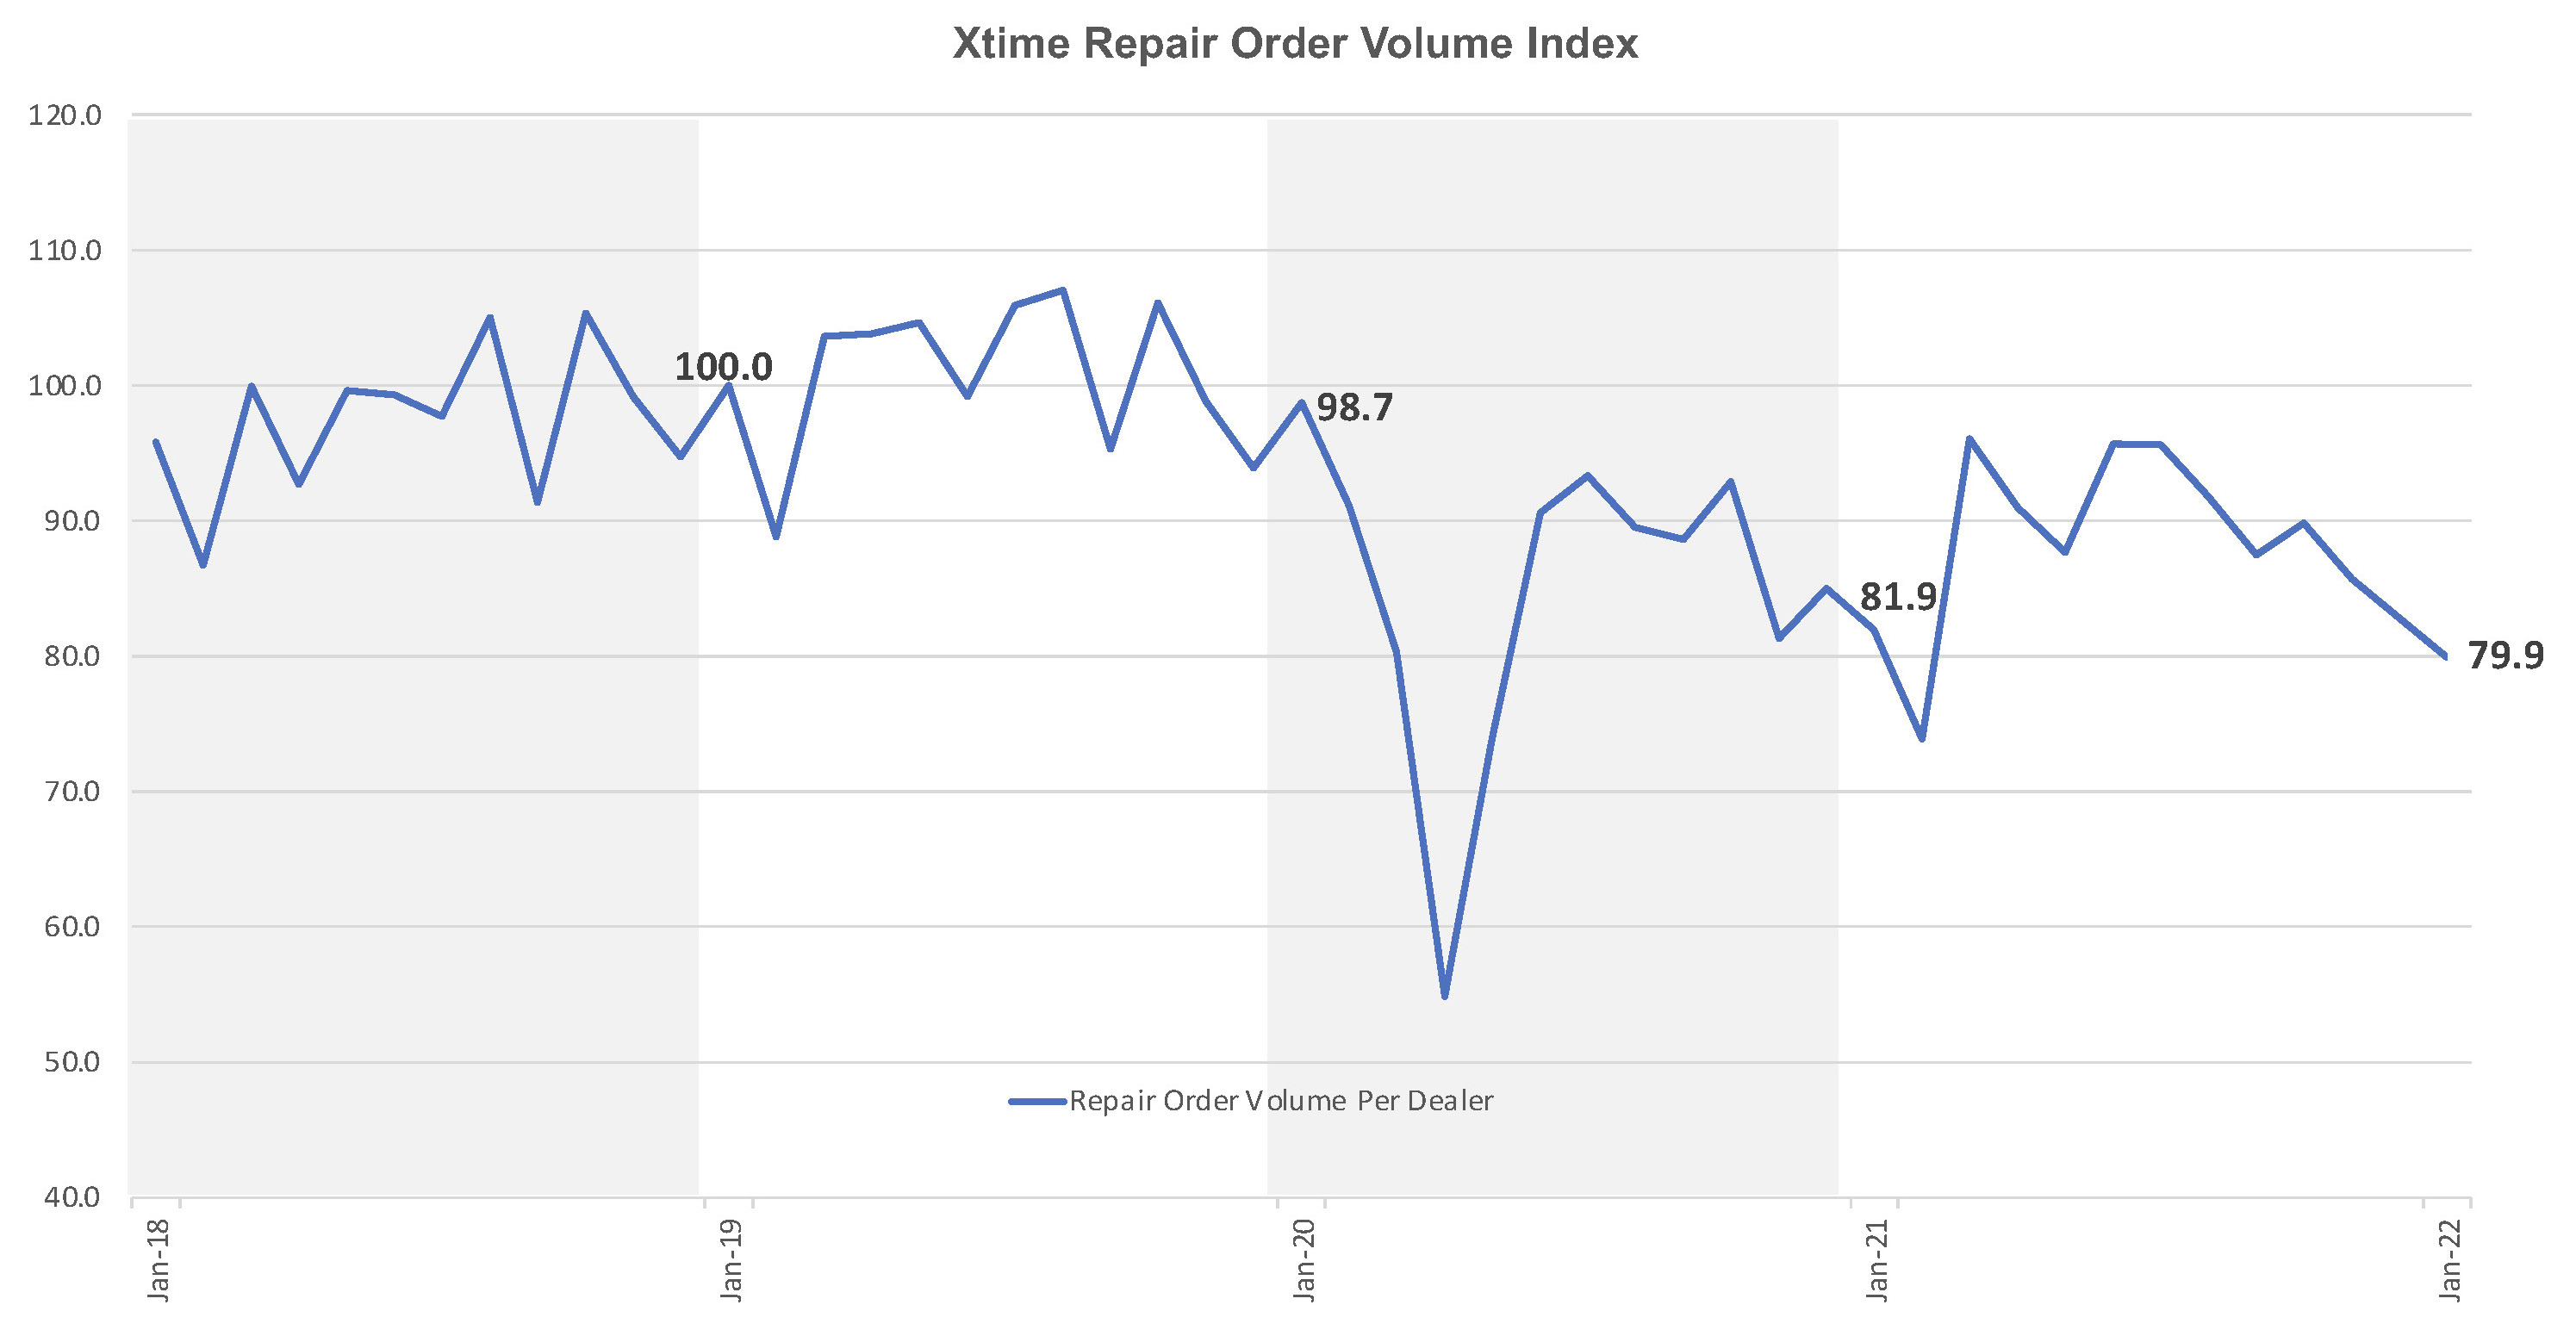
In January, the Repair Order Volume Index was down 9.0% month over month from December, at 79.9, and was down 2.4% from January 2021 but down 20.1% from January 2019.
The overall volume of repair orders being processed at U.S. franchised dealerships continues to be lower compared to the months prior to the onset of the global pandemic. Research from Cox Automotive indicates many consumers continue to delay having their vehicles serviced, although this number is down significantly from the height of the pandemic. Service trends on Xtime show the impact of COVID cases and winter weather, but pricing power remains. The month of January ended better than it started.
Xtime Repair Order Volume Index
The average revenue generated per repair order rose for the seventh straight month. At 121.5, the Repair Order Revenue Index in January was 11.1% higher than January 2021 and up 1.6% from December. The Revenue Index in January 2022 was also up 21.5% from January 2019.
Xtime Repair Order Revenue Index
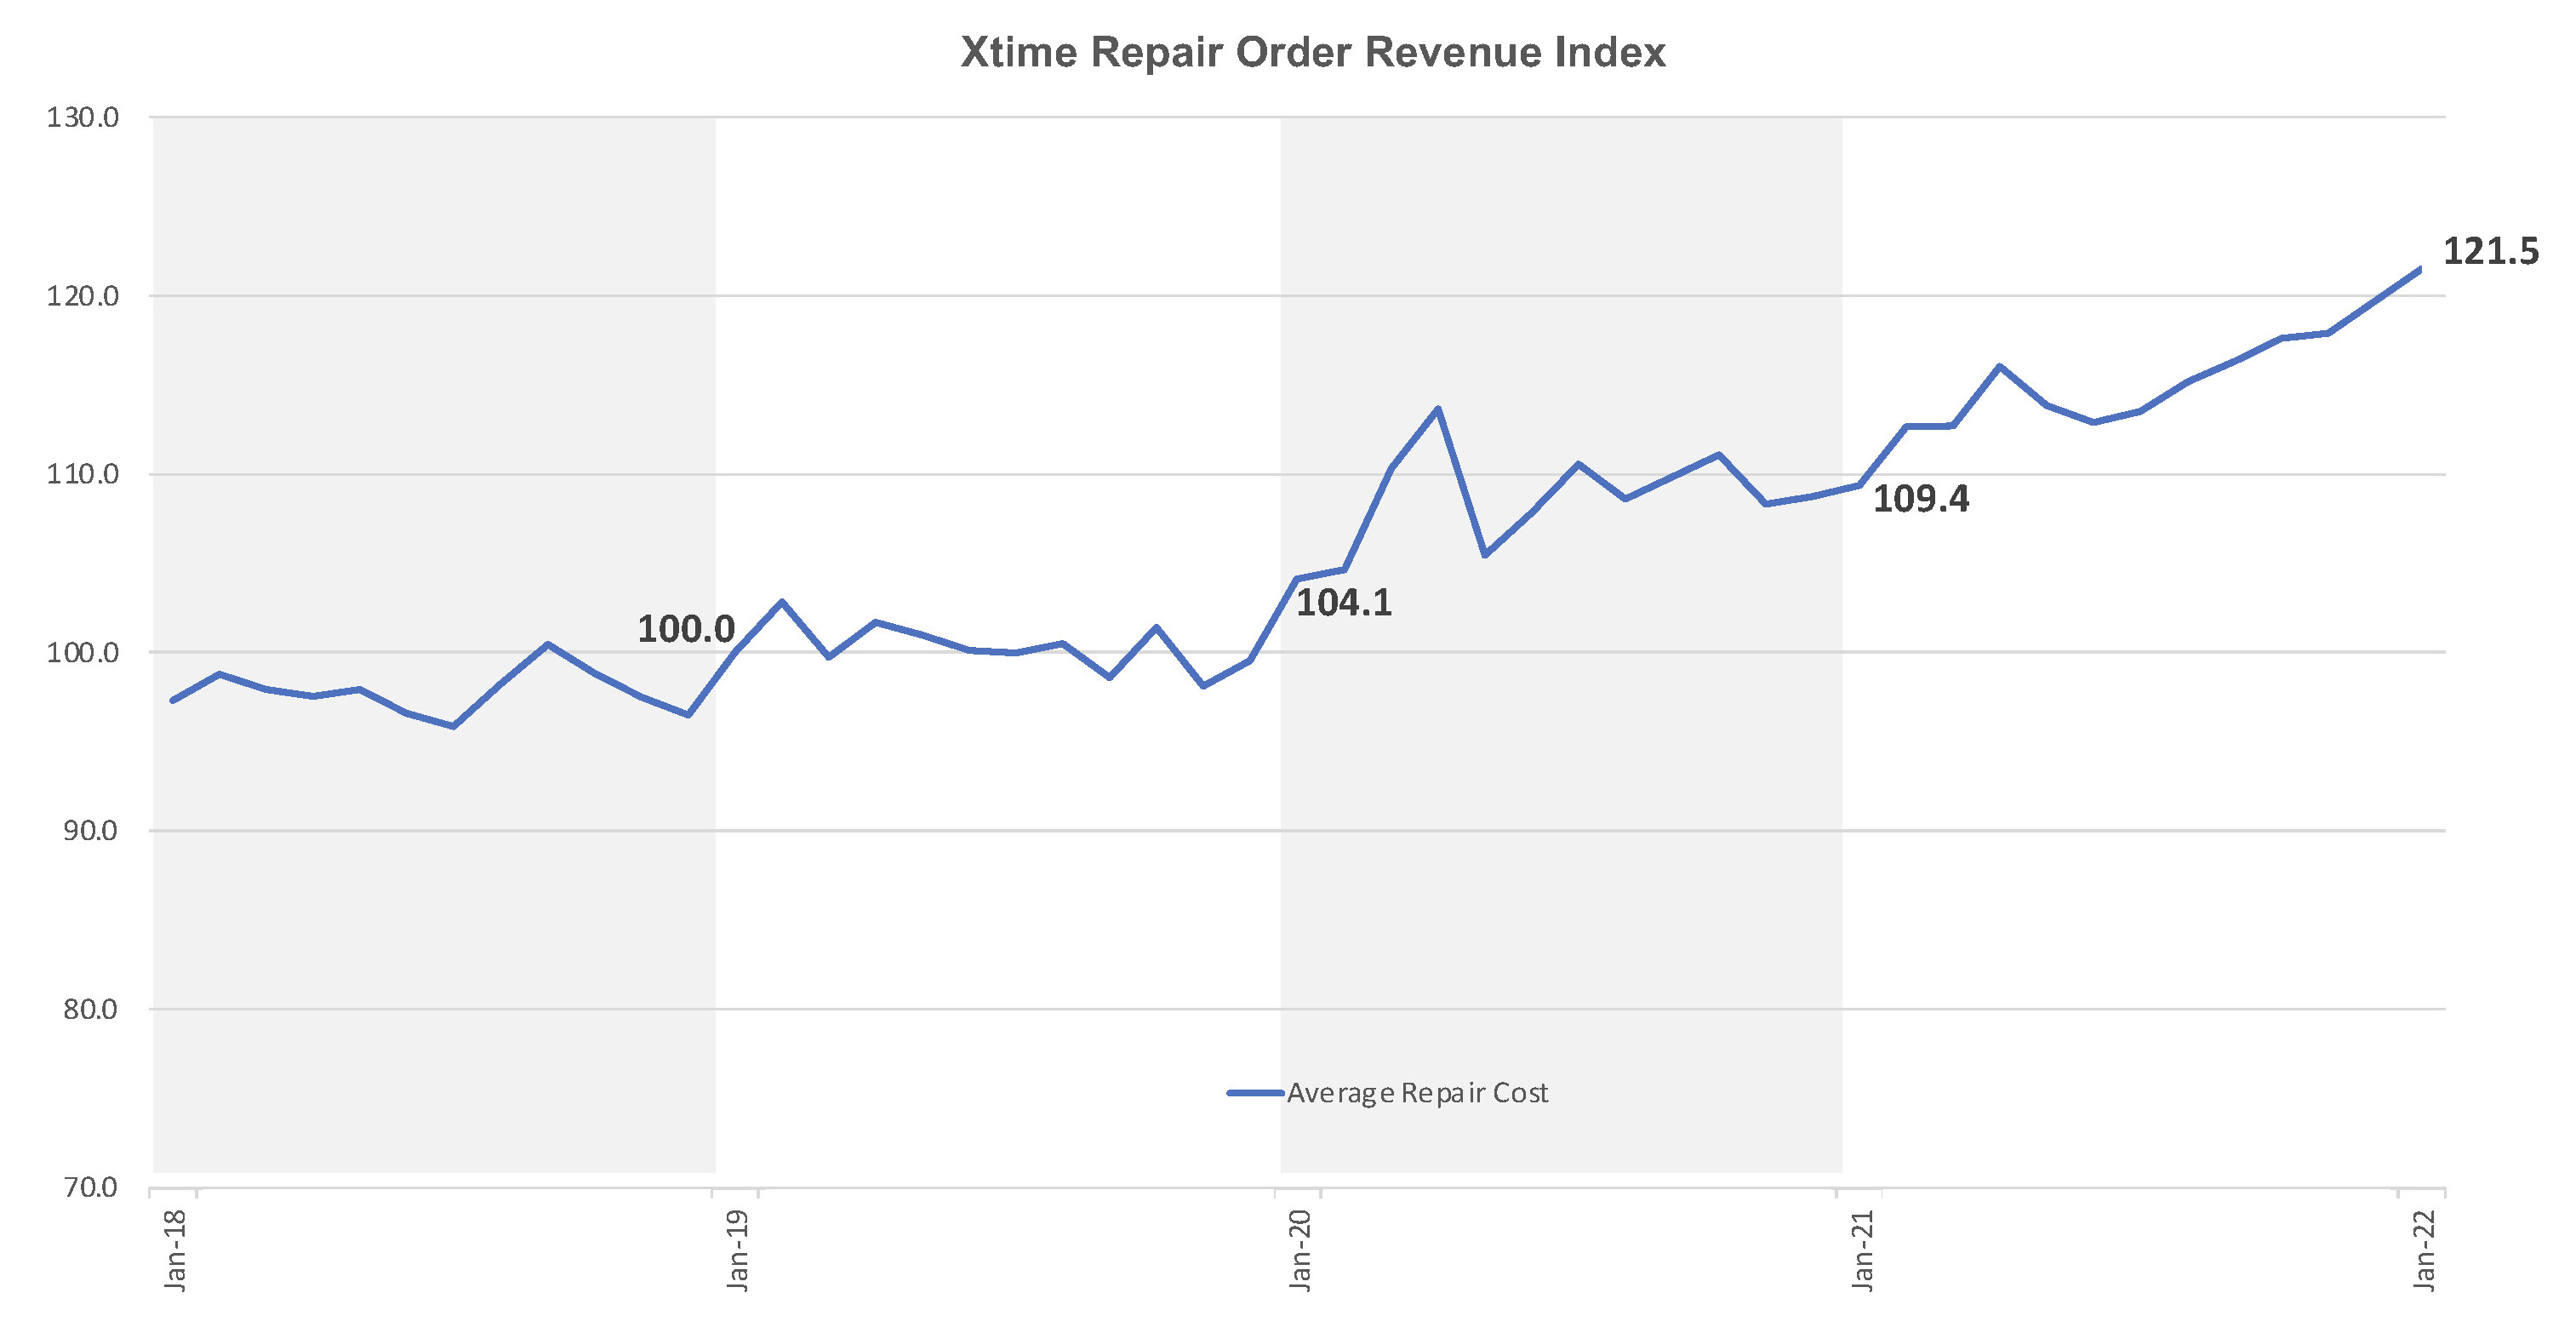
The overall trend line indicates revenue per repair order has taken a step change since the COVID-19 pandemic hit the auto industry. Each repair order generates more than $490 in revenue on average.
Cox Automotive Industry Insights, with help from the Xtime data team, will report the Repair Order Volume Index and Repair Order Revenue Index around the 20th of each month. For more information, reach out to the Cox Automotive Public Relations team.
Xtime is the leading end-to-end software solution that drives customer loyalty and revenue for automotive dealers in each stage of the service process. With easy-to-use technology and industry experts, Xtime helps dealers meet changing customer expectations. As an advanced, connected solution that provides exceptional support, Xtime is committed to helping dealers deliver the ultimate service experience. Through transparency, convenience, and trust, Xtime Spectrum — comprised of Schedule, Engage, Inspect, and Invite — facilitates more than ten million service appointments monthly. Xtime is a Cox Automotive™ brand.


