
Wholesale used-vehicle prices (on a mix, mileage, and seasonally adjusted basis) were unchanged in January compared to December. The Manheim Used Vehicle Value Index (MUVVI) remained at 204.0 but down 9.2% from a year ago. The index experienced the same 0.0% monthly change from December 2021 to January 2022.
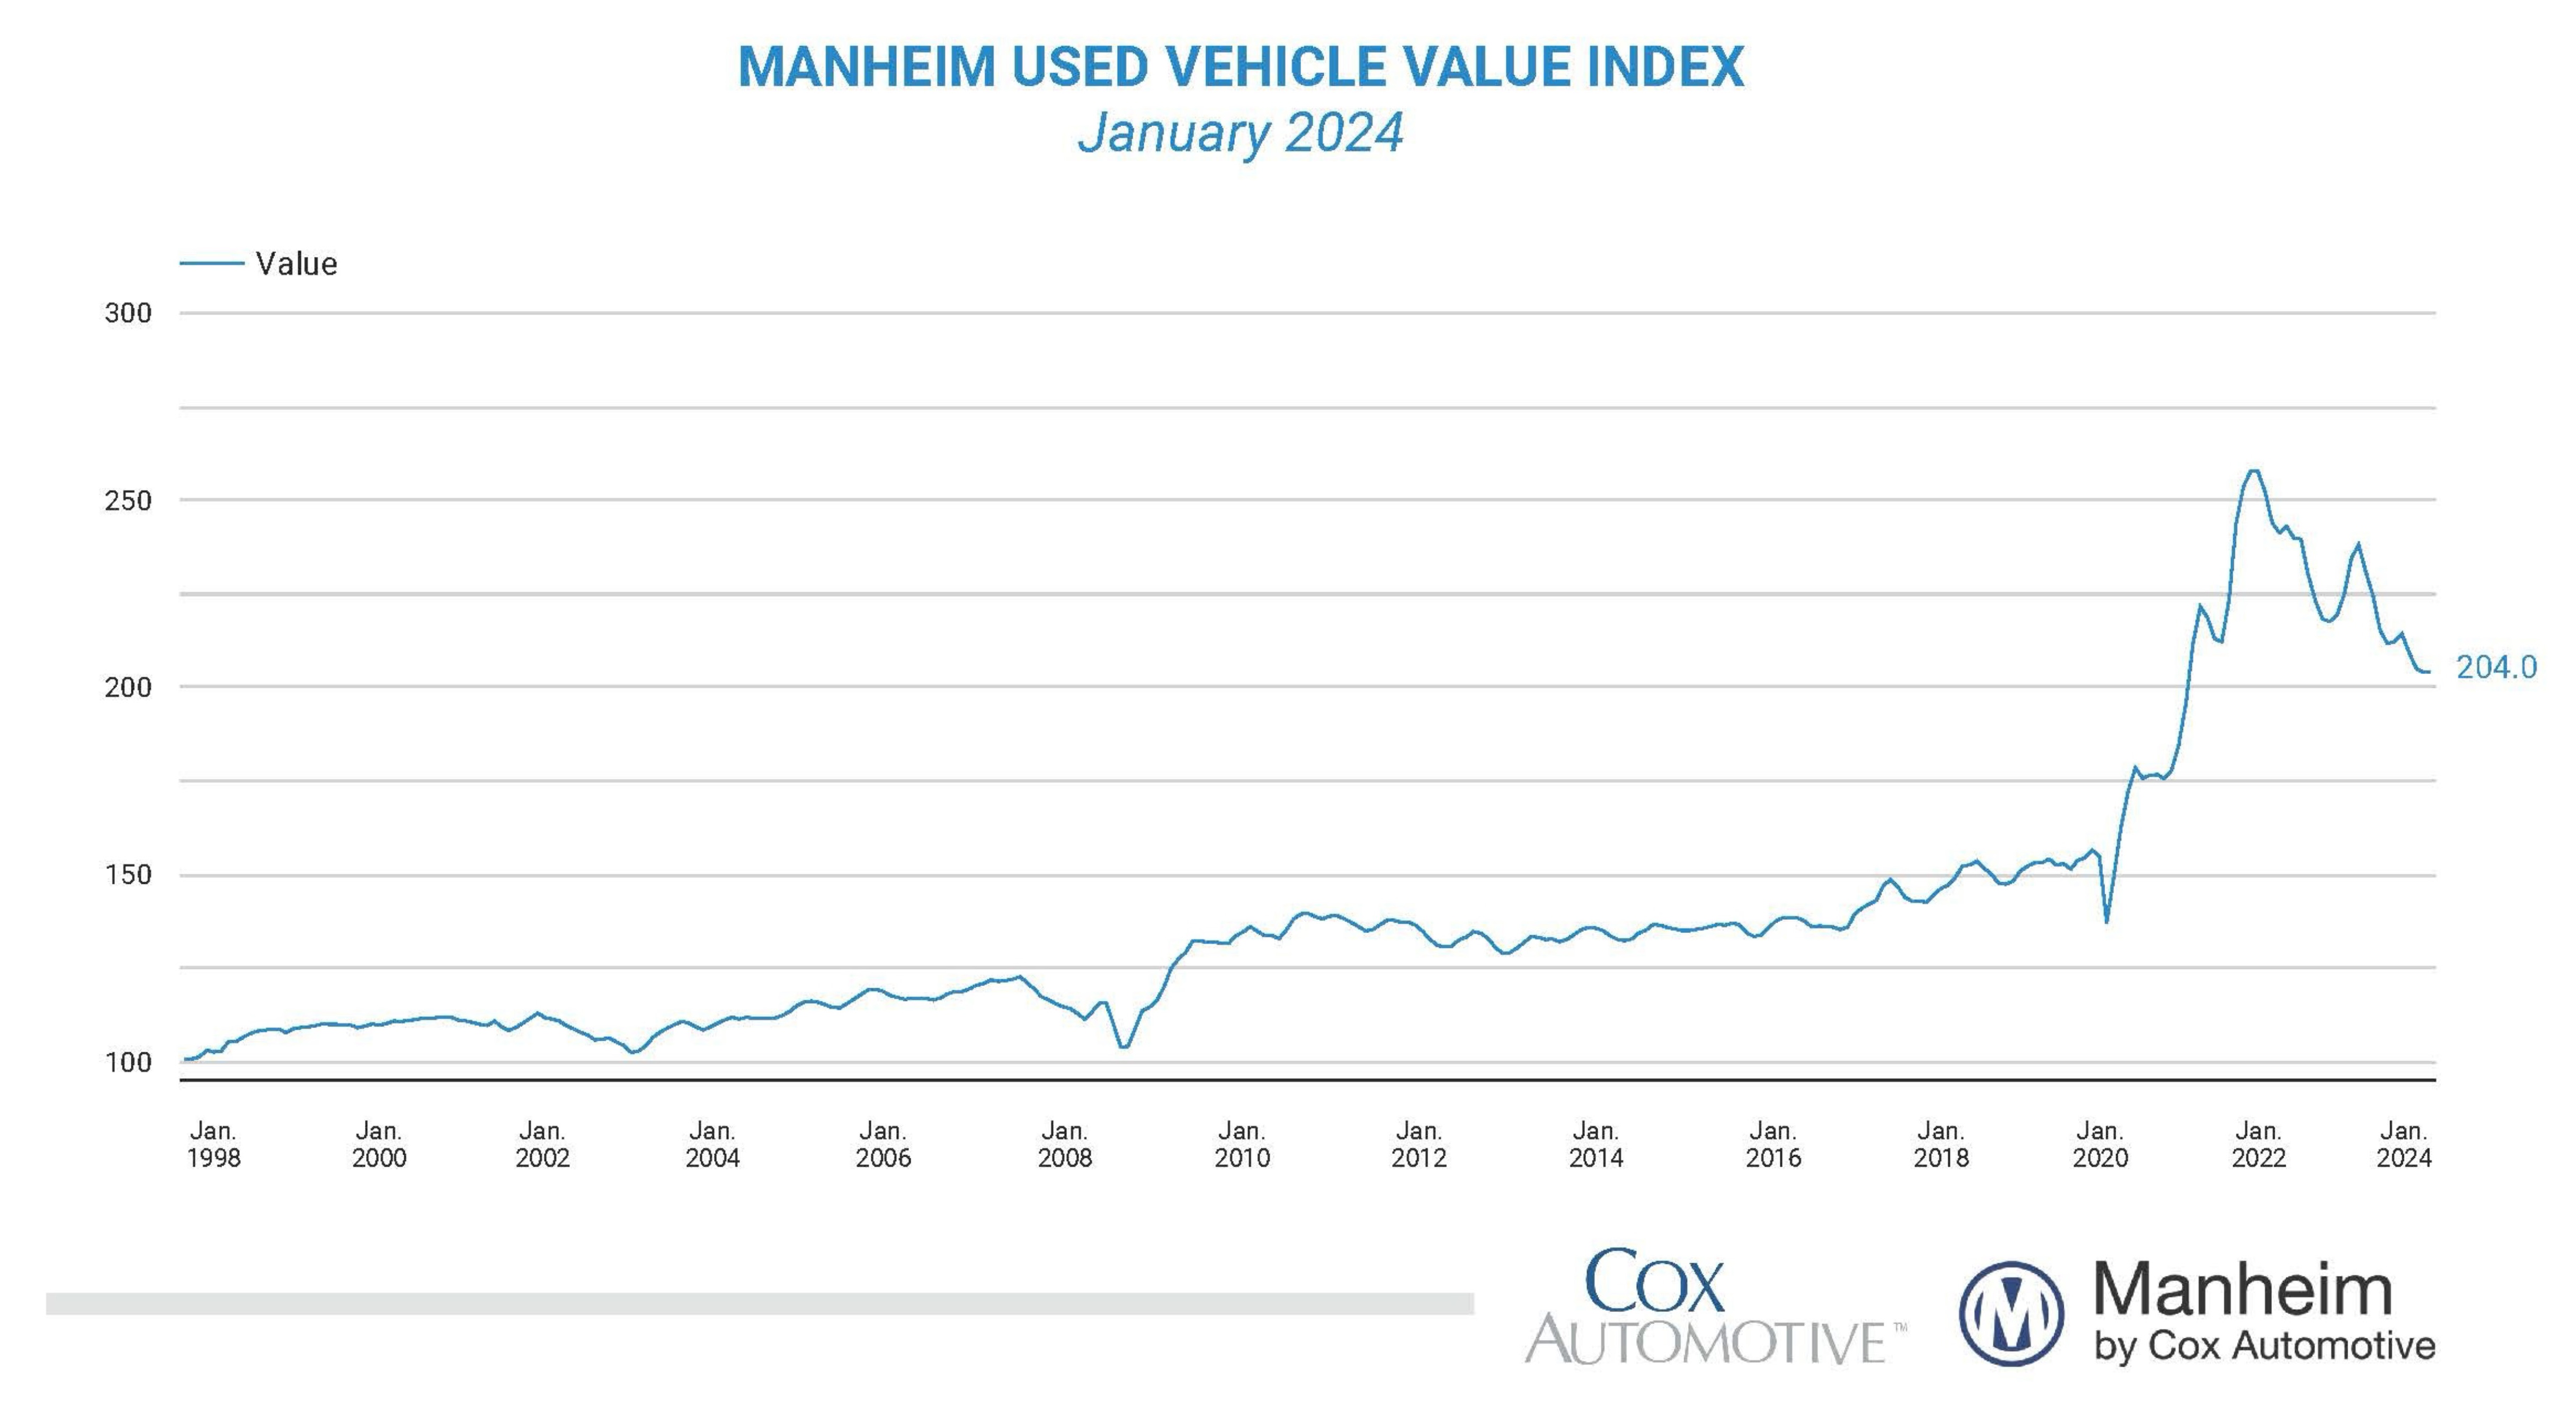
“With the volatility we saw last year, it was a welcome sign for the industry to have a calmer month,” said Jeremy Robb, senior director of Economic and Industry Insights for Cox Automotive. “We observed some price declines in the market in the first couple of weeks of January before the winter storm slowed activity in the wholesale markets during the King holiday week. As activity picked up later in the month, we saw more buying activity, which led to flat values in January. The 0.0% month-over-month change showed stronger values than the 0.2% decline we typically see in January. As we move into tax refund season, we expect to see a bit more activity in the wholesale market, and we maintain that 2024 should show more normal market trends through the year.”
The seasonal adjustment countered the January non-adjusted decrease. The non-adjusted price in January declined by 0.2% compared to December, moving the unadjusted average price down 9.3% year over year.
In January, Manheim Market Report (MMR) values saw above-average weekly declines for most of the month before flattening out in later weeks. Over the last four weeks, the Three-Year-Old Index fell an aggregate of 1.0%. Those same four weeks delivered an average decline of 0.1% between 2014 and 2019. Over the month of January, daily MMR Retention, which is the average difference in price relative to the current MMR, averaged 99.6%, meaning market prices were just below MMR values but moved higher than year-end. The average daily sales conversion rate increased to 56.0%, which indicates that demand was improving relative to year-end and fairly normal for this time of year. For comparison, the daily sales conversion rate averaged 55.5% in January during the last three years.
The major market segments saw seasonally adjusted prices that remained lower year over year in January. Compared to January 2023, luxury lost less than the industry, down 9.0%. Compact cars continued as the worst performers year over year, down 13.2%, followed by midsize cars, off by 10.9%, and pickups, down 9.9%. SUVs were flat to the industry’s 9.2% loss. Compared to last month, luxury lost 0.8%, SUVs were down 0.6%, and pickups declined 0.2%. Countering other segment losses, compact cars were up 0.4%, and midsize cars inched up 0.1%.
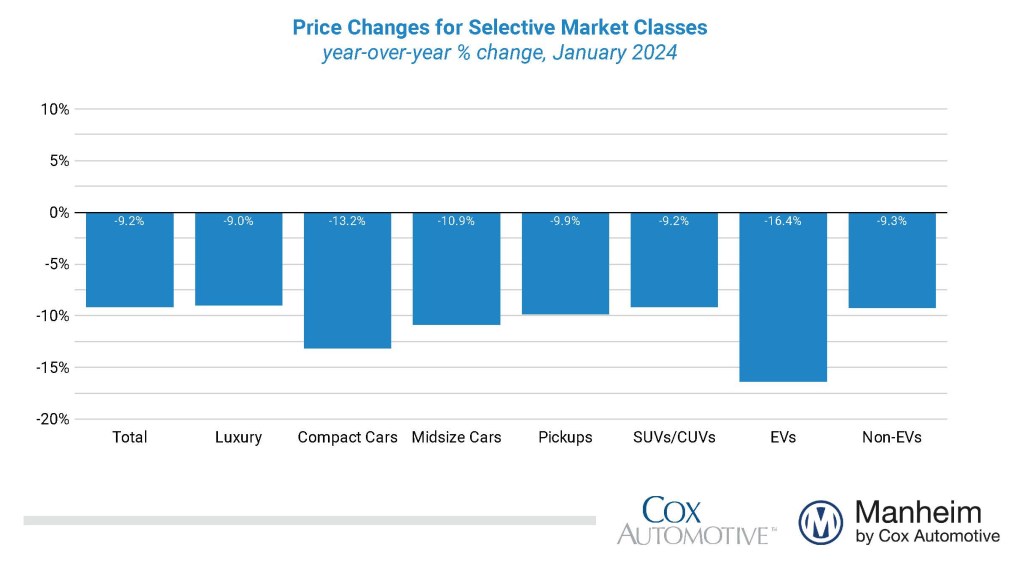
With the increase in interest in EV values versus the non-EV market, we are sharing metrics for those segments for the first time this month. As a reference point, seasonally adjusted EV values ended 2023 down 16.9%, while non-EVs were down 7.1% for the year. In January, seasonally adjusted EV values were down 16.4% from last year, while non-EVs declined 9.3% over the same period.
Used Retail Vehicle Sales Increased in January
Assessing retail vehicle sales based on observed changes in units tracked by vAuto, we initially estimate that used-vehicle retail sales in January were up 5% compared to December, while used retail sales are estimated to be down 3% year over year in January. The average retail listing price for a used vehicle declined 2.9% over the last four weeks.
Using estimates of used retail days’ supply based on vAuto data, an initial assessment indicates January ended at 53 days’ supply, down five days from a revised 58 days at the end of December but four days higher than how January 2023 ended at 49 days.
January’s total new-light-vehicle sales were up 2.8% year over year, with one more selling day than January 2023. By volume, January new-vehicle sales were down 26.2% month over month. The January sales pace, or seasonally adjusted annual rate (SAAR), came in at 15.0 million, a decrease of 0.7% from last year’s 15.1 million and down 6.9% from December’s revised 16.1 million pace.
Combined sales into large rental, commercial, and government fleets increased 3.1% year over year in January. Sales into rental fleets were up 20% year over year, sales into commercial fleets were down 14%, and sales into government fleets were up 6.6%. Including an estimate for fleet deliveries into dealer and manufacturer channels, the remaining retail sales were estimated to be up 4.1% from last year, leading to an estimated retail SAAR of 12.3 million, down 0.1 million from last year’s pace, and down from December’s 13.4 million pace. Fleet market share was estimated to be 16.8%, down 1% from last year’s share.
Rental Risk Prices Mixed; Mileage Dropped Significantly in January
The average price for rental risk units sold at auction in December declined 4.5% year over year. Rental risk prices also decreased by 3.3% compared to November. Average mileage for rental risk units in December (at 44,500 miles) was down 20.2% compared to a year ago and down 5.3% from November.
Most Measures of Consumer Confidence Saw Improvement in January
The Conference Board Consumer Confidence Index® increased by 6.3% in January, powered by views of the present situation jumping 9.6% and to the highest level since March 2020. Consumer confidence was up 8.3% year over year. Plans to purchase a vehicle in the next six months declined to the lowest level since April and were down year over year. Consumer sentiment also improved in January, according to the sentiment index from the University of Michigan. The Michigan index increased 13.3% for the month and was up 21.7% year over year. Consumer expectations for inflation in a year declined to 2.9%, which was the same expectation for inflation in five years. The consumer’s view of buying conditions for vehicles increased to the highest level since the summer of 2021 as views of prices and interest rates were less negative. The daily index of consumer sentiment from Morning Consult changed little, down 0.6% in January but up 12.6% year over year. Gas prices increased in January. According to AAA, the national average price for unleaded increased 1.3% to $3.15 per gallon as of Jan. 31, which was down 10% year over year.
The complete suite of monthly MUVVI data for January will be released on March 7, 2024, the fifth business day of the month, as regularly scheduled. The next quarterly MUVVI call will be held on April 5, 2024, at 11 a.m. EDT.
For questions or to request data, please email manheim.data@coxautoinc.com. If you want updates about the Manheim Used Vehicle Value Index, as well as direct invitations to the quarterly call sent to you, please sign up for our Cox Automotive newsletter and select Manheim Used Vehicle Value Index quarterly calls.
Note: The Manheim Used Vehicle Value Index was adjusted to improve accuracy and consistency across the data set as of the January 2023 data release. The starting point for the MUVVI was adjusted from January 1995 to January 1997. The index was then recalculated with January 1997 = 100, whereas prior reports had 1995 as the baseline of 100. All monthly and yearly percent changes since January 2015 are identical. Learn more about the decision to rebase the index.


