
The monthly new-vehicle average transaction price (ATP) report from Cox Automotive’s Kelley Blue Book was released today. Key takeaways in January include:
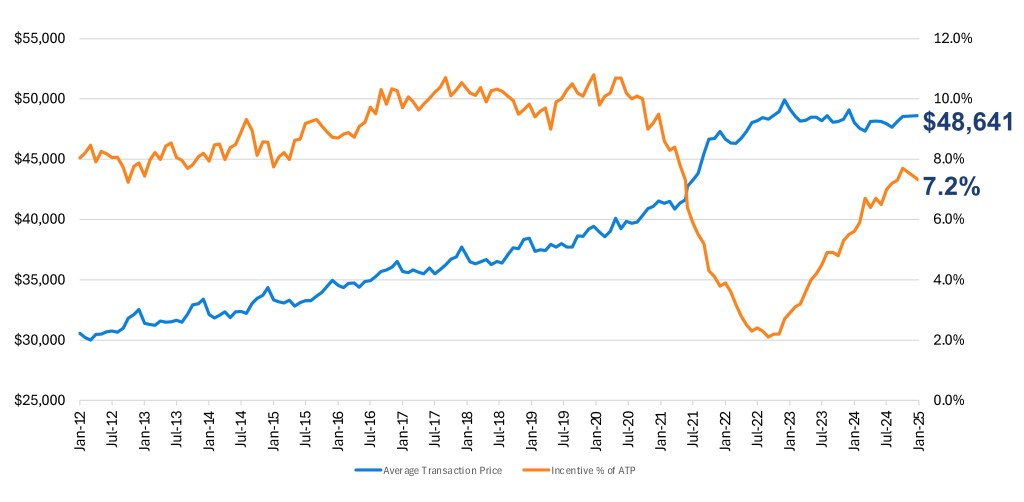
- The new-vehicle ATP in January was lower versus December by 2.2%, falling to $48,641. The January ATP increased year over year by 1.3%. A year ago, the new-vehicle ATP was $48,031.
- Sales incentives declined last month, falling from 8.0% of ATP in December to an average of 7.2% of ATP in January. Incentive packages in January, at roughly $3,486, were 29.2% higher year over year. In January 2024, the average incentive package was equal to 5.6% of ATP.
- ATPs often drop notably month over month in January, as the mix of luxury brand sales peaks in December and tumbles in January. Many of the top luxury brands, including Audi, BMW, Cadillac and Lexus posted significantly fewer sales in January compared to December, with some brands’ sales volumes lower by more than 50%. With fewer high-priced vehicles in the sales mix, ATPs generally trend lower.
- The year-over-year ATP increase of approximately 1.3% in January was well below long-term averages. From 2020 to 2024, ATPs increased an average of 4.9% a year, with average gains of 9% or more in both 2021 and 2022. In the seven years prior, from 2013 to 2019, new-vehicle ATPs, on average, were higher year over year by approximately 3.0%.
- Total new-vehicle sales volume in January was higher year over year by 5.1% but lower by more than 25% compared to a surprisingly strong December. New-vehicle inventory at the start of January was below 3 million units for the first time since late October.
NEW-VEHICLE AVERAGE TRANSACTION PRICE

Quote from Erin Keating, Executive Analyst Cox Automotive.
“After a surprisingly hot December, both new-vehicle sale volume and prices were lower in January as the market took a seasonal breather. Notably, Jeep brand ATPs in January were lower year over year by almost 9%, as the storied make continues to manage a perceived price challenge. In fact, Jeep ATPs in January were close to $49,000, not far from the industry average, and the lowest point in more than three years.”
INDUSTRY AVERAGE TRANSACTION PRICE VERSUS INDUSTRY AVERAGE INCENTIVE SPEND AS % OF ATP
Electric Vehicle Prices Hold Steady in January; Incentive Spending Drops 3.1% from December
- ATPs for EVs in January, at $55,614, were higher by nearly 1% compared to a downwardly revised December. EV prices last month were lower year over year by 1.4%. Incentive spending on EVs in January decreased by 3.1% compared to December but was higher by 48.6% year over year.
- Compared to the overall industry, EV ATPs were higher by 14.3%. A year ago, the price premium versus the industry was 17.4%.
- ATPs for market leader Tesla, at $55,380, were higher year over year by 4.5%. Cybertruck prices declined year over year by 6.5% to just under $98,000. Model X prices were also lower year over year. The two most popular EVs in the U.S., the Model Y and Model 3, both saw transaction prices increase year over year by 2.2% and 6.2%, respectively.


