
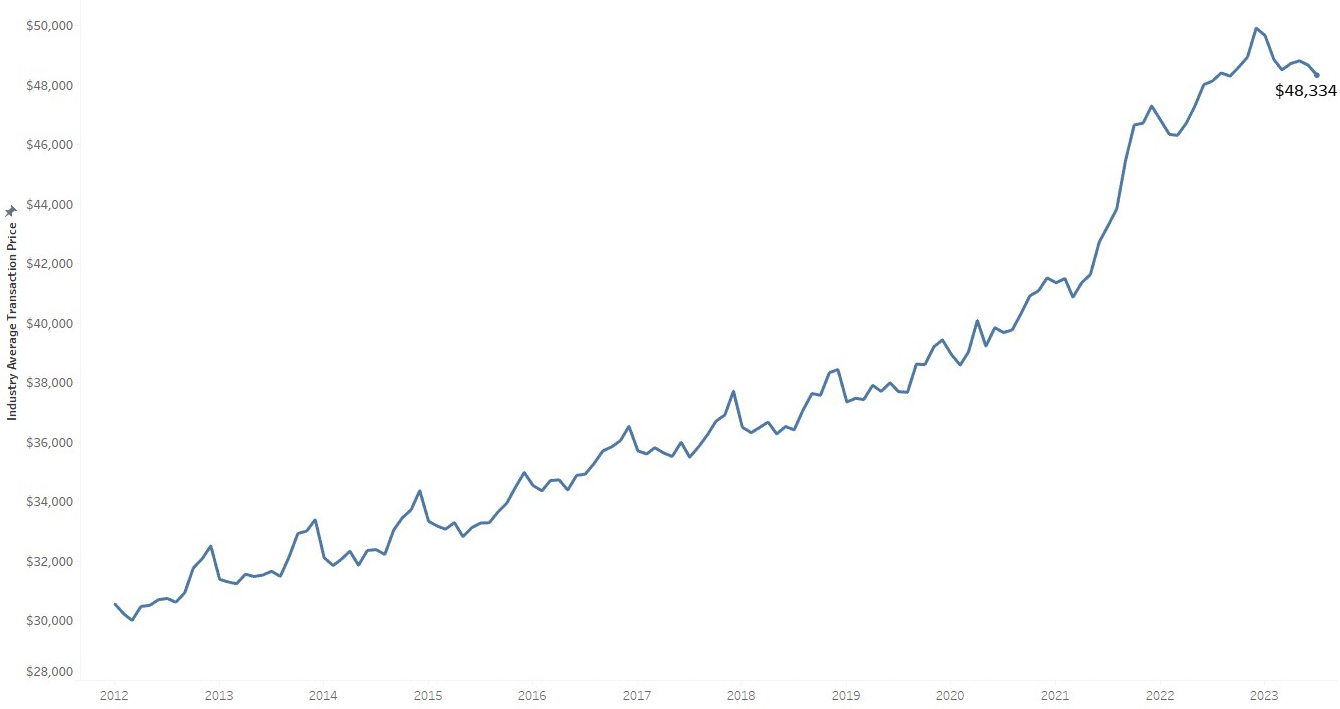
Correction, Aug. 16, 2023 – ATLANTA, Aug. 9, 2023 – The average price Americans paid for a new vehicle in July 2023 was 0.4% higher than one year ago, the smallest year-over-year price increase in the last decade. According to Kelley Blue Book, a Cox Automotive company, the average transaction price (ATP) of a new vehicle in July was $48,334, a month-over-month decrease of 0.7% ($337) from June’s ATP of $48,671, and up only $199 from one year ago. Compared to the start of the year, transaction prices are down 2.7%, or $1,335, the largest January to July tumble in the past decade.
NEW-VEHICLE AVERAGE TRANSACTION PRICE
“New-vehicle price inflation has all but disappeared in 2023,” said Rebecca Rydzewski, research manager at Cox Automotive. “New-vehicle prices, primarily driven by cuts in luxury and electric vehicles, are decreasing as inventory is steadily improving. With higher inventories and higher incentives helping to keep downward pressure on prices, there certainly are good reasons for shoppers to be heading back into the market.”
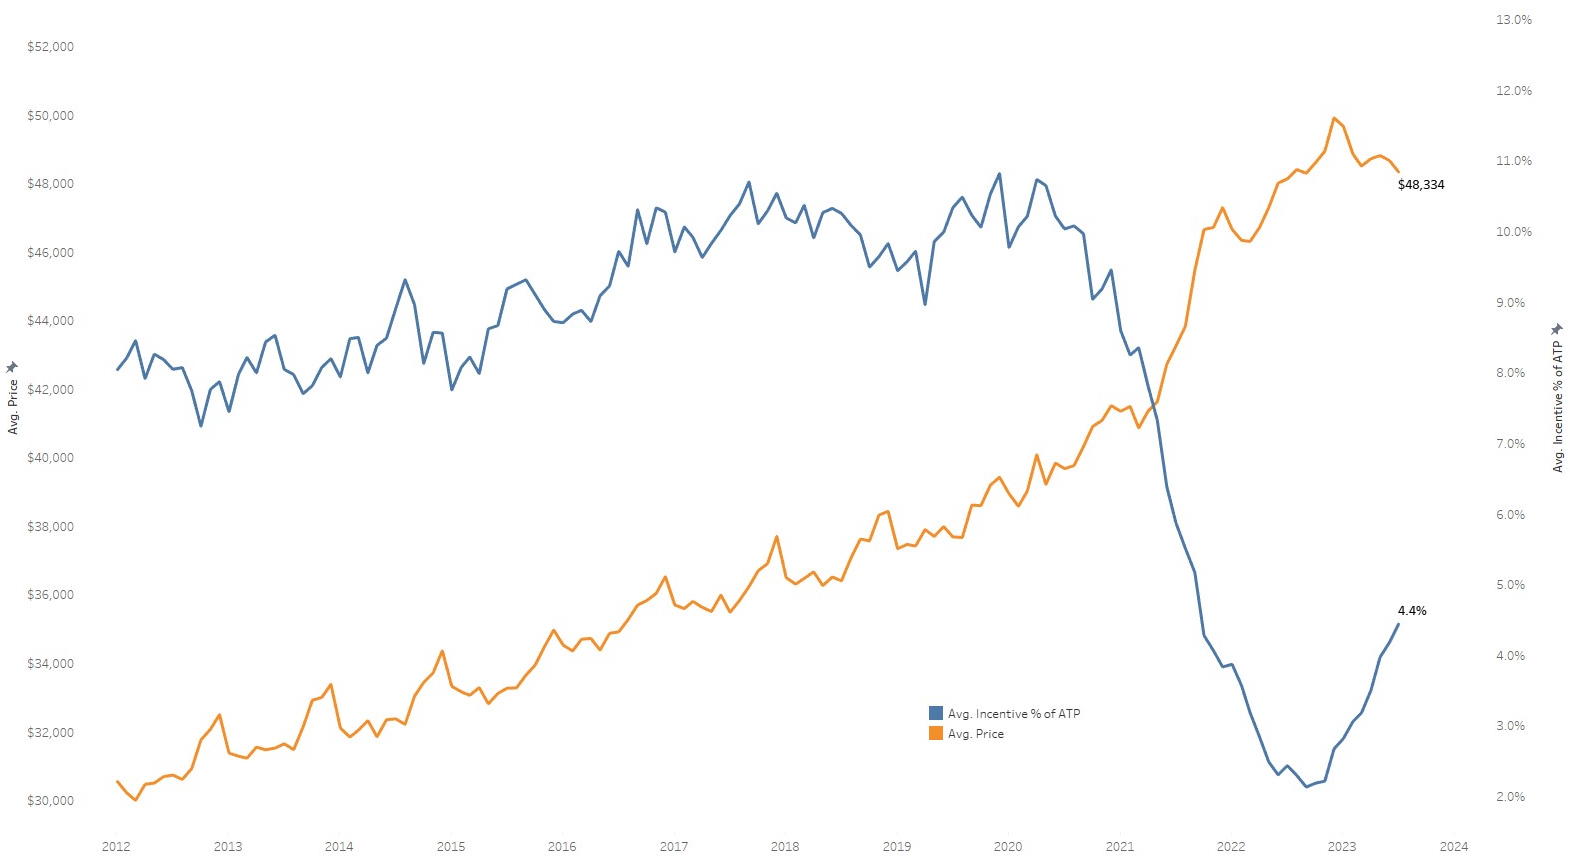
Auto manufacturers’ incentive spend increased for the tenth consecutive month in July to the highest level since October 2021, averaging $2,148, or 4.4% of the average transaction price. One year ago, average incentive spending was 2.4% of ATP.
Average Prices for Non-Luxury Vehicles Decreased in July
The average price paid for a new, non-luxury vehicle in July was $44,700, down $471 compared to June. Year over year, non-luxury prices increased by only 0.5%. However, non-luxury vehicle prices have held remarkably steady since January, fluctuating up and down by only a few hundred dollars.
The bigger story is that unlike five years ago, only one model transacted below $20,000 in July. The Mitsubishi Mirage’s average transaction price in July is reported as $19,205. In July 2018, there were a dozen vehicles with ATPs below the $20,000 barrier. In comparison, many of today’s smallest vehicles, including the Hyundai Venue, Kia Rio, Nissan Versa and Toyota Corolla, are all transacting well over $20,000. Notably, and in stark contrast to the under $20,000 category, there were 32 vehicles in the Kelley Blue Book database transacting on average over $100,000 in July, which excludes super exotics from Ferrari, Lamborghini, Rolls-Royce and the like. In comparison, five years ago, in the summer of 2018, there were only 12 vehicles in the over $100,000 category.
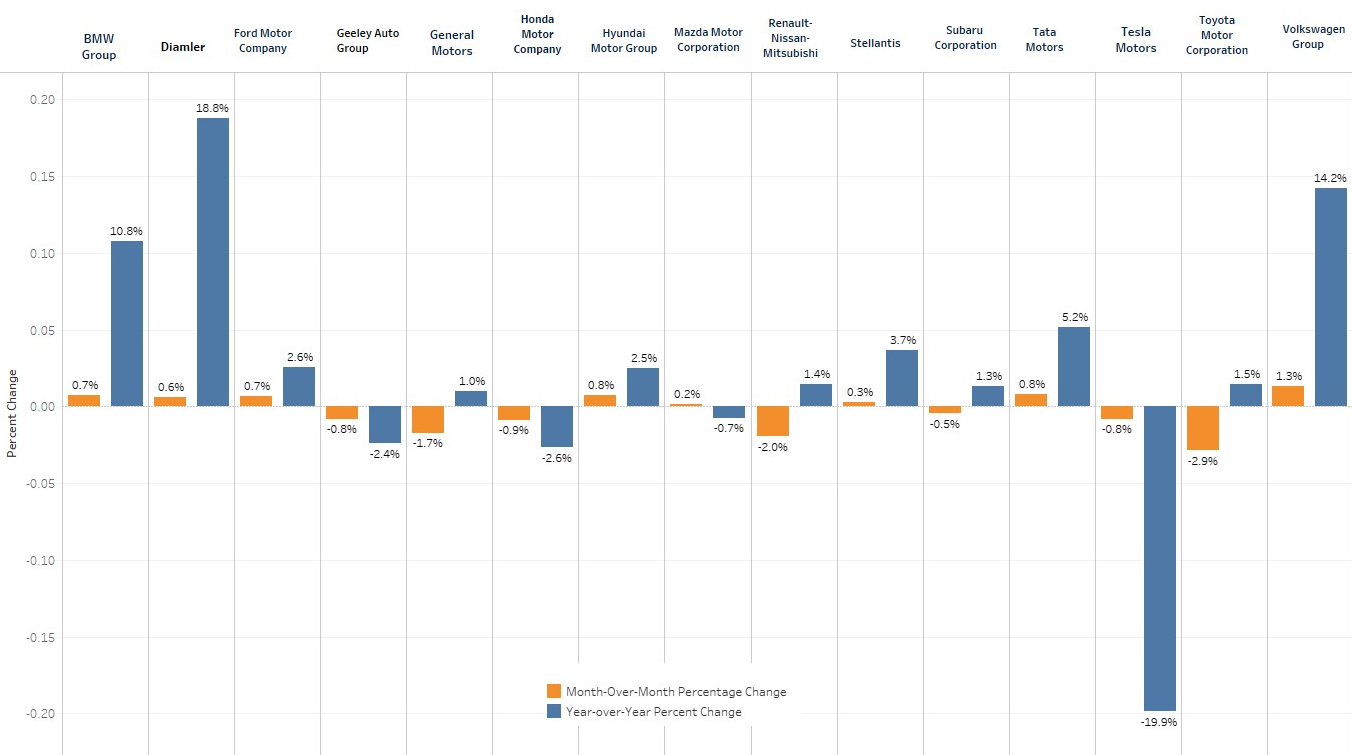
PRICE CHANGE PERCENTAGE BY AUTOMAKER
The average incentive spend in the non-luxury segment was 4.3% of ATP in July, up from 2.5% one year ago. Mainstream brands with particularly tight inventory – Honda, Kia and Toyota – raised their incentive spending in July but were still below the industry average.
Average Luxury Prices Down Year Over Year, Largest Decline in a Decade
Luxury vehicle prices in July were down almost 3% year over year. The average luxury buyer paid $63,552 in July, down $192 from June. Since the start of the year, luxury prices have declined by more than 5%. Luxury market leader Tesla has slashed prices by more than 19% in the past year, and from the start of the year, prices are down more than 12%1. According to Kelley Blue Book estimates, the average Tesla buyer spent $54,660 for a new vehicle in July, down from more than $62,000 in January and the lowest ATP for Tesla since April 2020.
Overall, the luxury segment continued to deliver strong results in July. The luxury share of the U.S. market was 19.3% in July, the highest share so far in 2023. According to Kelley Blue Book estimates, the lower prices at Tesla are likely helping with sales volume. In July, Tesla volume reached a record high of 59,813 units.
Electric Vehicle Prices Continue to Decline
EV prices continue to fall, once again led by market leader Tesla. In July, the average EV ATP was $53,469, down from $53,682 in June and down from more than $61,000 in January. Incentives for EVs in July were 6.7% of ATP, or $3,755. EV ATPs are down more than 19% from their recent peak of more than $66,000 just a little more than a year ago in June 2022. The price declines in the EV segment have mirrored the inventory increases experienced by some automakers. At the end of July, the EV segment days’ supply was 100 days, while industry days’ supply stood at 54. (Cox Automotive days’ supply calculations include vehicles in dealer inventory and in-transit/pipeline units but do not include Tesla).
“The year-over-year decline of EV ATPs has been led by Tesla slashing prices on its popular models,” added Rydzewski. “Tesla prices are down nearly 20% [in the past year], and other EV models, such as the Ford F-150 Lightning, have been following Tesla’s lead. While automakers report losing money on electric vehicles, they continue to aggressively pursue EV growth strategies.”
Auto Incentives Offered by Manufacturers Reach One-Year High
Incentives averaged $2,148 in July to reach the highest point in a year, increasing to 4.4% of the average transaction price compared to 4.2% in June. While July incentives increased by $112 month over month, they remain historically low. For comparison, Kelley Blue Book estimates incentives averaged 5.9% of ATP in July 2021 and 10.3% in July 2019.
INDUSTRY AVERAGE TRANSACTION PRICE VERSUS INDUSTRY AVERAGE INCENTIVE SPEND AS % OF ATP
The high-end luxury car segment had the highest incentives in July 2023 at 9.6% of ATP, followed by luxury cars at 8.4%, hybrid vehicles at 7.7%, entry-level luxury cars at 6.9% and electric vehicles at 6.7%. Full-size luxury SUVs, high-performance cars and sports cars had some of the lowest incentives in July.
1 Correction: An earlier version of this story incorrectly reported the Tesla year-to-date price reduction.


