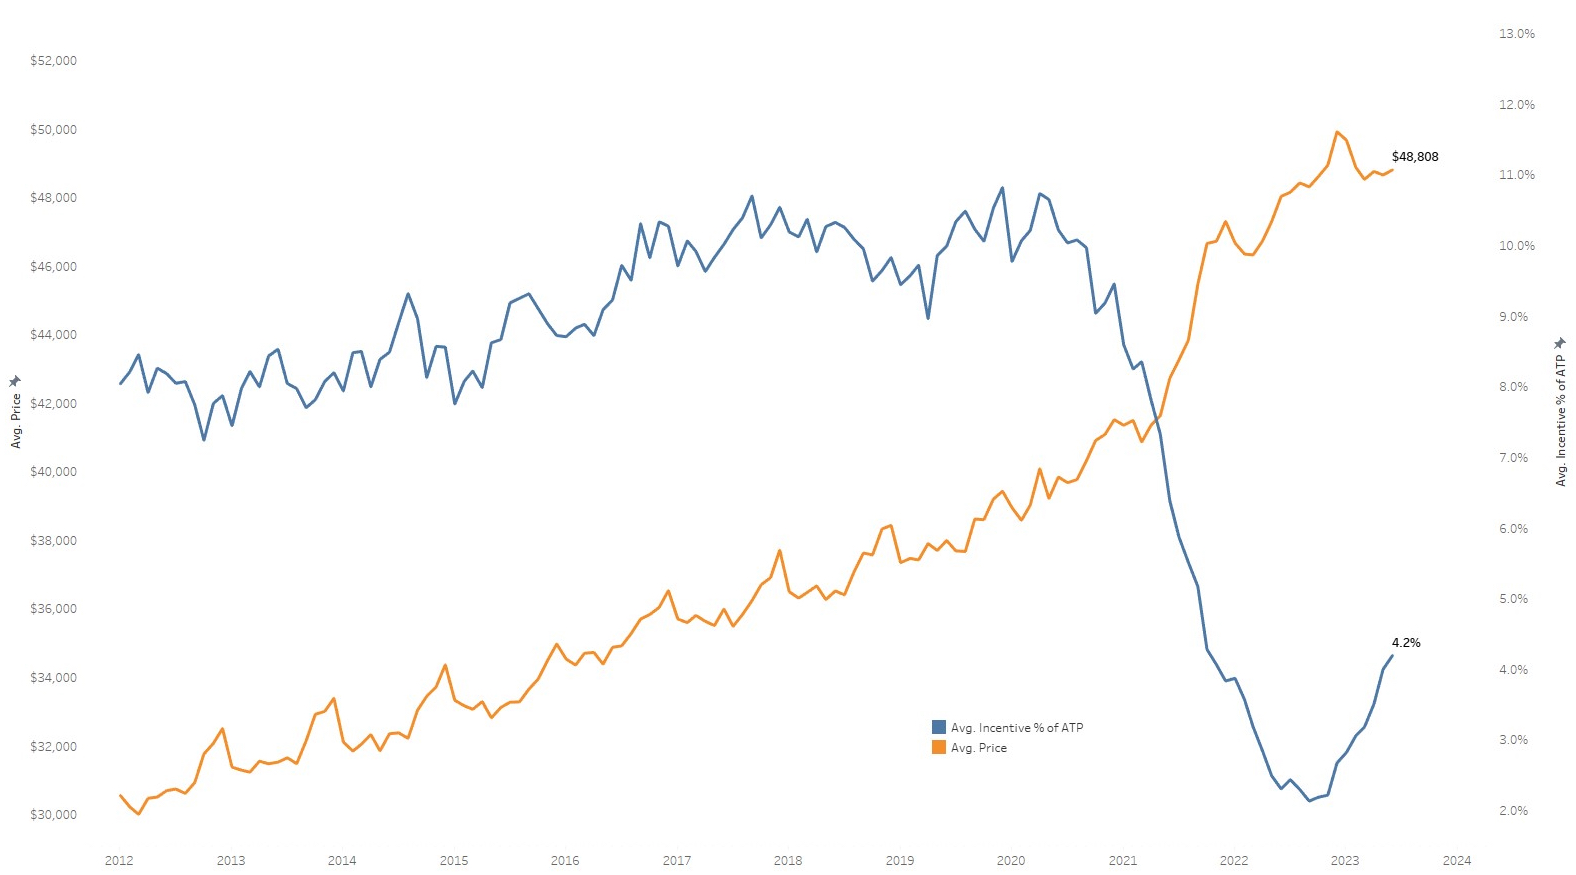
ATLANTA, July 11, 2023 – The average price Americans paid for a new vehicle in June 2023 was 1.6% higher than one year ago, the smallest year-over-year price increase since the start of the global pandemic. According to Kelley Blue Book, a Cox Automotive company, the average transaction price (ATP) of a new vehicle in June was $48,808, a month-over-month increase of 0.3% ($150) from an upwardly revised May reading of $48,658. Compared to the start of the year, however, transaction prices are down 1.7%, or $865, the largest January to June tumble in the past decade.
NEW-VEHICLE AVERAGE TRANSACTION PRICE
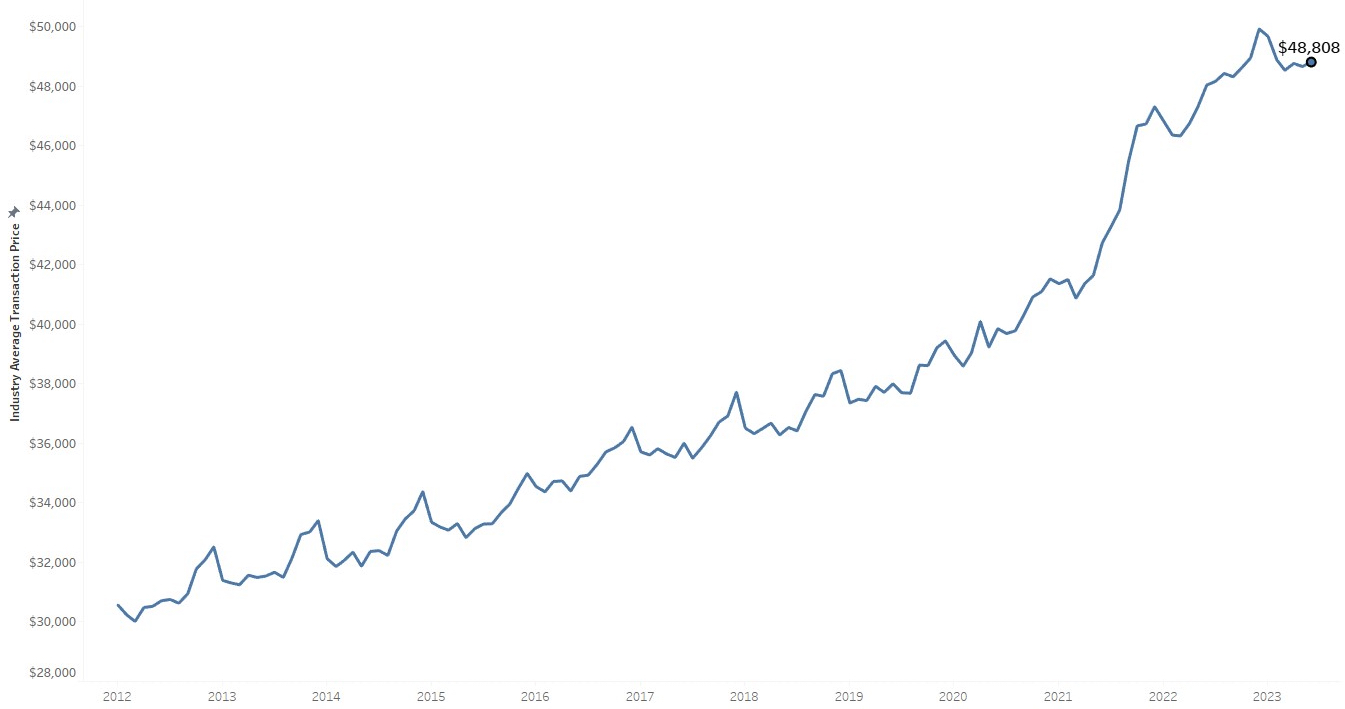
“The fact that average transaction prices are up a meager 1.6% year over year in June is notable,” said Michelle Krebs, executive analyst at Cox Automotive. “A year ago, the industry was looking at transaction prices that were consistently up 10% to 12% year over year. With no inventory in place, it was inflation gone wild. Now, as inventory has been consistently building and supply and demand are finding a balance, the price gains seem to be well under control. In fact, average transaction prices are down from the start of the year. That’s good news for shoppers.”
For comparison, in June 2022, new-vehicle transaction prices were up 12% year over year. In all of 2022, the smallest year-over-year gain was in October, when prices were higher by only 4.2%. A year earlier, in October 2021, prices were up 14% year over year as inflation raged in the new-vehicle market.
Meanwhile, auto manufacturers’ incentive spend increased for the ninth consecutive month in June to the highest level since October 2021, averaging $2,048, or 4.2%, of the average transaction price. One year ago, average incentive spending was 2.3% of ATP.
In June 2023, the average price consumers paid for a new vehicle fell to $345 below manufacturers’ suggested retail price (MSRP), or sticker price. For comparison, a year ago, the average ATP was $698 above MSRP. Supported partly by improved pricing, new-vehicle sales in June by volume were the highest since May 2021. Sales into fleet and increasing incentives contributed to the 20.7% year-over-year volume gain. Compared with May, new-vehicle sales were up 0.5% in June.
Average Prices for Non-Luxury Vehicles Essentially Flat in June
The average price paid for a new, non-luxury vehicle in June was $45,291, up only $17 compared to May. Year over year, non-luxury prices increased by 2.5%. Since January, though, non-luxury vehicle prices have held remarkably steady. Six months ago, the non-luxury ATP was $45,555.
The average incentive spend was 4.0% of ATP in June in the non-luxury segment, up from 2.4% one year ago. Mainstream brands with particularly tight inventory continued to keep incentive spending down in June, with Toyota, Kia and Honda all well below the industry average in incentive spending.
Average Luxury Prices Down Year Over Year, Driven Mostly by Tesla Price Cuts
In contrast to the non-luxury segment, luxury vehicle prices in June were down more than 2% year over year. The average luxury buyer paid $63,977 last month, up $305 from May. Since the start of the year, luxury prices have declined by more than 4%. Tesla, the luxury market leader, has slashed prices by more than 11% so far in 2023. In June, according to Kelley Blue Book estimates, the average Tesla buyer spent $55,106 for a new vehicle, down from more than $62,000 in January.
Overall, the luxury segment continued to deliver strong results in June. The luxury share of the U.S. market was 18.8% last month, up from 18.4% in May. Luxury share in the first half of 2023 peaked in January when it hit 19.1% of the market.
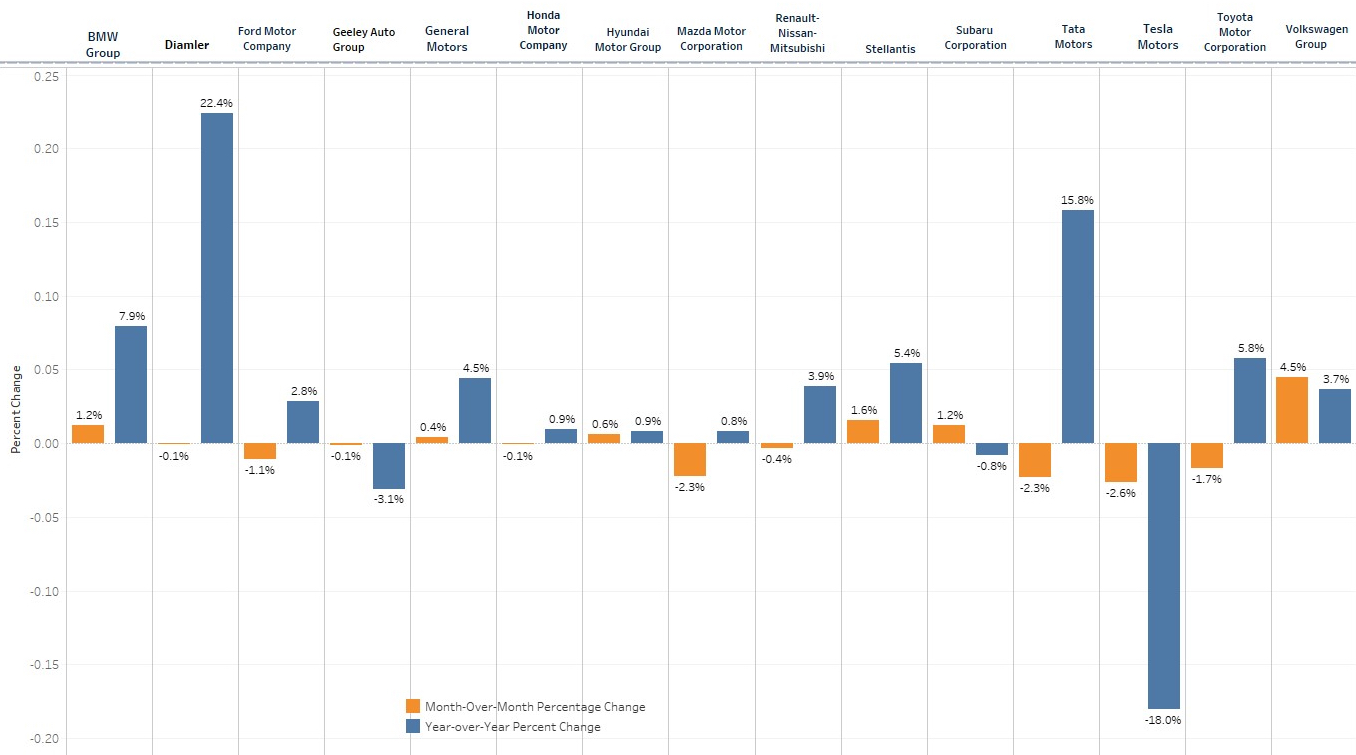
PRICE CHANGE PERCENTAGE BY AUTOMAKER
New Electric Vehicle Prices Down 20% From One Year Ago
EV prices continue to fall, again led by market leader Tesla. In June, the average EV ATP was $53,438, down from a revised $54,528 in May and down from more than $61,000 in January. Incentives for EVs in June were 7.1% of ATP, behind only luxury vehicles. EV ATPs are down nearly 20% from their recent peak of $66,390 in June 2022. The price declines in the EV segment follow inventory increases experienced by some automakers in 2023. Overall, as measured by days’ supply, the EV category is well above the overall industry. At the end of June, the EV segment days’ supply was 103 days, while industry days’ supply stood at 53.
“The steep drop in average EV prices this year, led by Tesla price cuts, has been a key driver of overall, industry-wide price moderation,” added Krebs. “A year ago, the average EV price was above the average luxury vehicle price. Today, as inventory and availability build, EV prices are moving closer to the industry average.”
Auto Incentives Offered by Manufacturers Reach One-Year High
Incentives averaged $2,048 in June to reach the highest point in a year, increasing to 4.2% of the average transaction price compared to 4.0% in May. While June incentives increased by $102 month over month, they remain historically low. For comparison, Kelley Blue Book estimates incentives averaged 6.4% of ATP in June 2021 and 10.0% in June 2019.
The luxury car segment had the highest incentives in June 2023 at 7.4% of ATP, followed by electric vehicles at 7.1%. Meanwhile, incentives on vans remained at the lowest level at only 0.3% of ATP.
INDUSTRY AVERAGE TRANSACTION PRICE VERSUS INDUSTRY AVERAGE INCENTIVE SPEND AS % OF ATP