Data Point
New-Vehicle Sales Incentives Continue to Climb in May, as Transaction Price Increases Moderate, According to Kelley Blue Book
Monday June 12, 2023
Article Highlights
- The overall average transaction price for a new vehicle in the U.S. rose in May 2023. Both non-luxury and luxury prices increased slightly.
- Incentives increased further in May to the highest level in a year, averaging $1,914, or 3.9%, of the average transaction price.
- The average transaction price in May was up less than 1% from April and 3% from year-ago levels, as price increases slow.
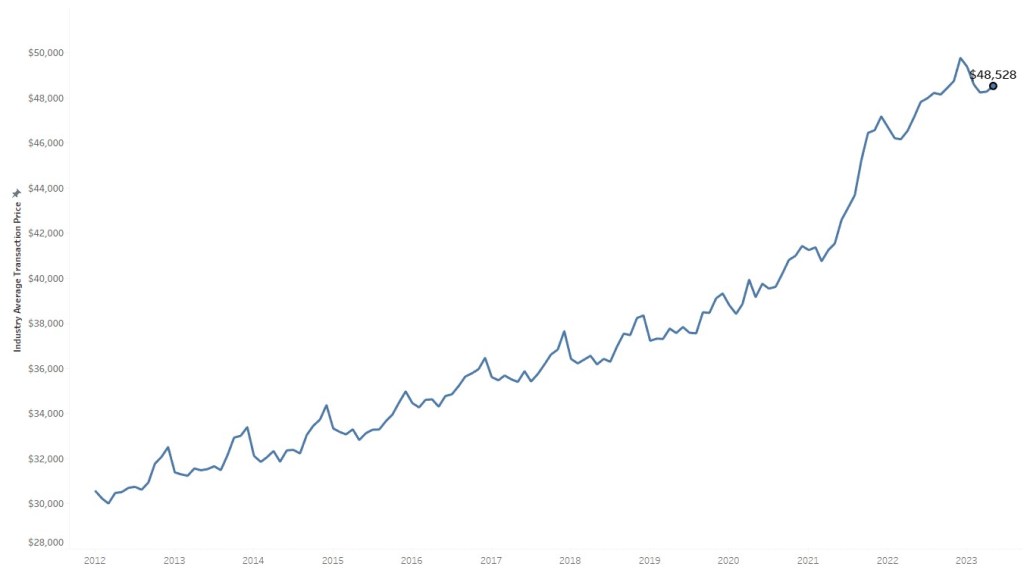
ATLANTA, June 12, 2023 – The average price Americans paid for a new vehicle in May remained below the manufacturer’s suggested retail price (MSRP) for the fifth consecutive month, according to data released today by Kelley Blue Book, a Cox Automotive company. The average transaction price (ATP) of a new vehicle in the U.S. increased in May 2023 to $48,528, a month-over-month increase of 0.5% ($251) from an upwardly revised April reading of $48,277.
NEW-VEHICLE AVERAGE TRANSACTION PRICE
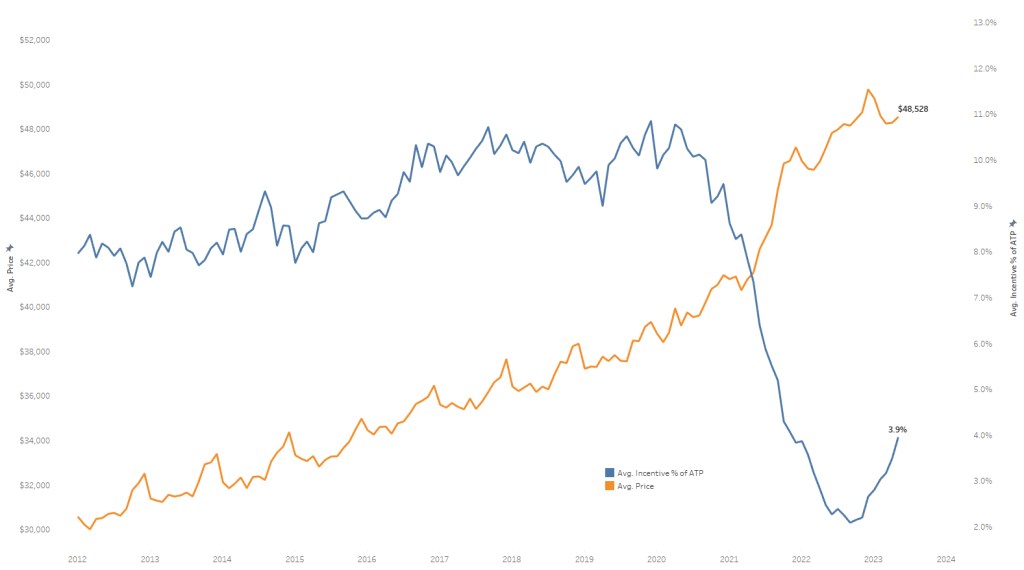
New-vehicle transaction prices in May were up 3% ($1,393) compared to year-ago levels. The year-over-year increase in May of 3% was the smallest in 2023; in May 2022, new-vehicle prices were up 13.5% year over year. Meanwhile, auto manufacturers’ incentive spend in May rose to the highest level in the past year at 3.9% of the ATP, averaging $1,914. One year ago, average incentive spending was 2.5% of ATP.
In May 2023, the average price consumers paid for a new vehicle fell to $410 below MSRP, or sticker price. For comparison, a year ago, the average ATP was $637 above MSRP. As lower prices and higher inventory levels likely drew in buyers, sales volumes in May were up month over month by 0.7% and up 22.1% year over year, higher than most forecasts and fed in part by a healthy dose of fleet deliveries.
“The modest new-vehicle price increase in May was offset by increased incentives, so many buyers were able to find deals below sticker,” said Rebecca Rydzewski, research manager of Economic and Industry Insights for Cox Automotive. “This is good news for consumers as manufacturers are seeing higher inventory and increased competition and need to push sales to keep inventory moving.”
Average Prices for Non-Luxury Vehicles Rise Slightly in May
The average price paid for a new non-luxury vehicle in May was $44,960, an increase of $158 compared to April. Year over year, non-luxury prices increased by 3.7%. The average non-luxury sticker price rose to $45,362 in May, so buyers paid below MSRP by $402.
A few non-luxury brands – including Ford, Kia, Mazda and Mini – saw ATP increases month over month in May. Honda and Kia showed the most price strength in the non-luxury market and were the only two brands transacting at more than 1% above sticker price in May.
Average Prices for Luxury Vehicles Rise in May but Remain Below $65,000
The average luxury buyer paid $64,396 for a new vehicle in May 2023, up $239 from April, and the second month in a row that transaction prices for luxury were below $65,000. Across key segments, luxury vehicle ATPs were a mixed bag in May, with high-end luxury cars and luxury full-size SUVs showing price declines between 0.5% and 1.6%. Entry-level luxury cars ATP remained stable. Luxury cars and luxury full-size SUVs saw price increases between 0.1% and 3.3%.
Strong luxury vehicle sales have been a primary reason for overall elevated new-vehicle prices. This trend continued in May, with the luxury vehicle share at 18.4% of total sales. However, luxury share is trending down after hitting a high of 19.5% in February 2023.
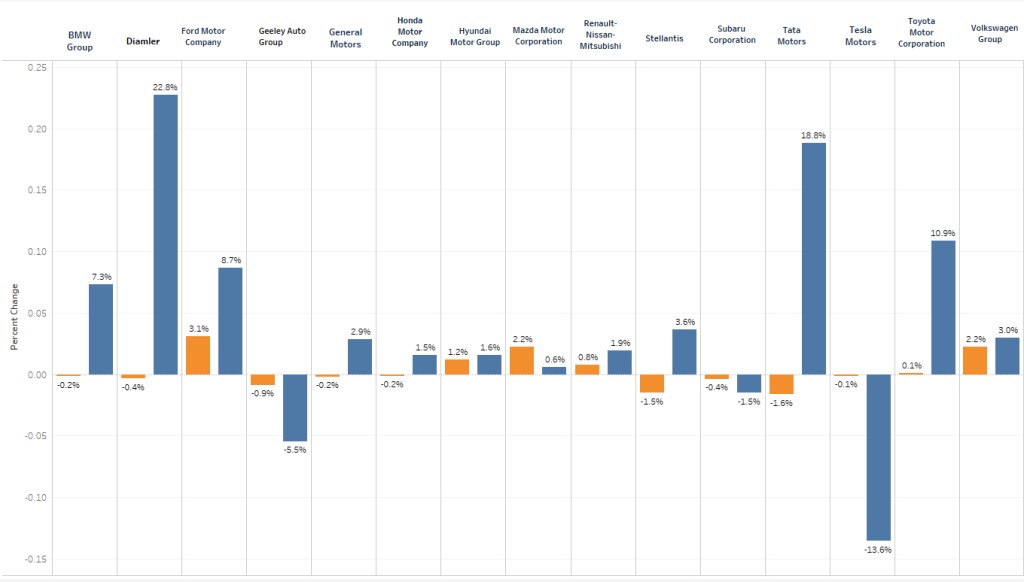
PRICE CHANGE PERCENTAGE BY AUTOMAKER
New Electric Vehicle Prices Down More Than $9,000 from One Year Ago
The initial estimate for the average price paid for a new electric vehicle (EV) in May is $55,488, mostly stable from last month and aligned with the industry change. The ATP for EVs in May 2023 is down a noteworthy $9,370 (down 14%) compared to one year ago. New EV pricing peaked in June 2022 and has fallen more than $5,800 so far in 2023. EV incentives are trending higher.
“When it comes to EVs, automakers are trying to find a balance between pricing and profitability,” said Michelle Krebs, executive analyst at Cox Automotive. “EV sales in May are estimated to have increased by 4.7% compared to April and are up 44% year over year. This may be due to a combination of tax credits and manufacturer incentives that are encouraging sales.”
Auto Incentives Offered by Manufacturers Continue Trending Upward as Supply Increases
Incentives averaged $1,914 in May to reach the highest point in a year, increasing to 3.9% of the average transaction price compared to 3.5% in April. While May incentives increased by $229 month over month, they remain historically low. For comparison, Kelley Blue Book estimates incentives averaged 7.3% of ATP in May 2021 and 9.9% in May 2019. The luxury car segment had the highest incentives in May 2023 at 7.7% of ATP. Meanwhile, vans had the lowest incentives at only 0.3% of ATP.
“Incentives are up to nearly 4% in May, a sign that automakers are trying to move vehicles,” said Rydzewski. “The majority of luxury brands have higher inventory levels than the current industry average, along with all the domestic non-luxury brands. As supply continues to increase, industry average incentives will keep increasing.”


