
Wholesale used-vehicle prices (on a mix-, mileage-, and seasonally adjusted basis) decreased 2.7% from March in the first 15 days of April. The midmonth Manheim Used Vehicle Value Index dropped to 231.7, which was down 4.0% from the full month of April 2022. The seasonal adjustment contributed to the decline. The non-adjusted price change in the first half of April was an increase of 0.6% compared to March, while the unadjusted price was down 5.1% year over year.
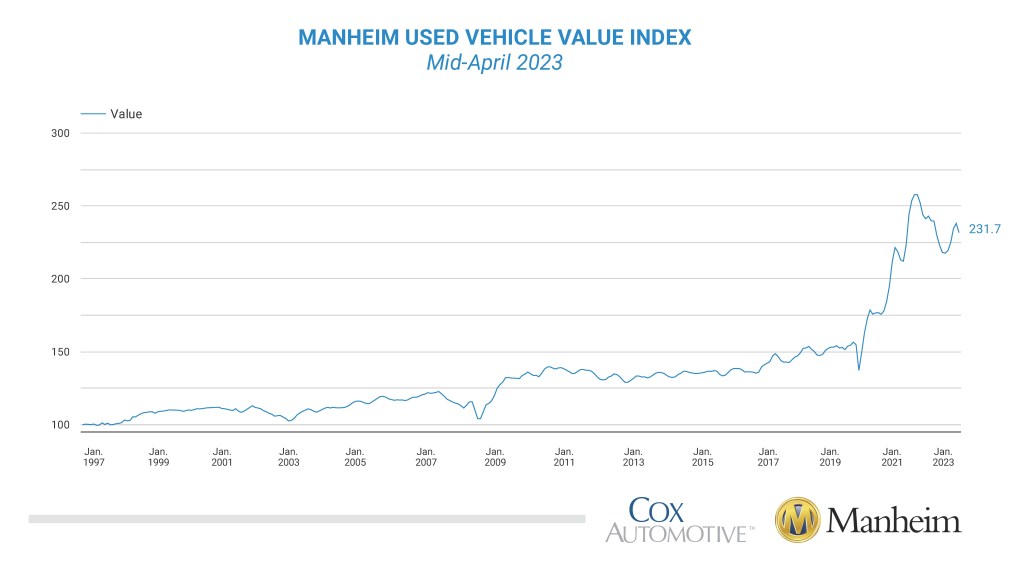
Over the last two weeks, Manheim Market Report (MMR) prices were effectively unchanged. Prices usually start to decline in the first two weeks of April, as the average price change for these weeks in the six years from 2014 through 2019 was a decline of 0.3%; but in each of the last two years, prices increased substantially over these same weeks. Over the first 15 days of April, MMR Retention, the average difference in price relative to current MMR, averaged 99%, indicating that valuation models are ahead of market prices. The average daily sales conversion rate of 61.4% in the first half of April declined relative to March’s daily average of 64.9% and was below the April 2019 daily average of 63.6%.
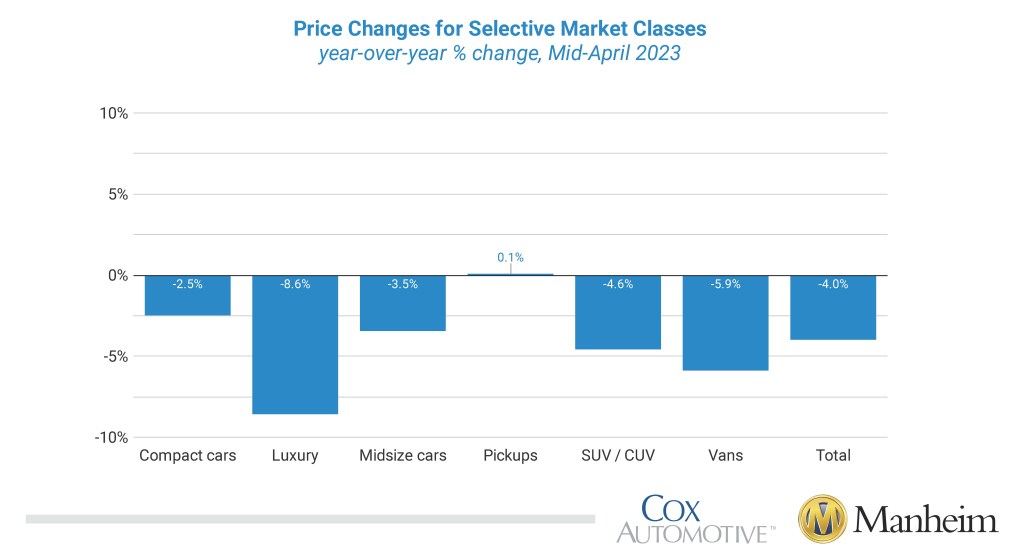
Seven of eight major market segments saw seasonally adjusted prices that were again lower year over year in the first half of April. Pickups had a minimal 0.1% increase, while only midsize and compact cars lost less compared to the overall industry in seasonally adjusted year-over-year changes. The remaining segments lost between 4.6% and 8.6%, with luxury units again faring the worst. Seven of eight major segments saw price decreases compared to March, with losses ranging from 1.2% to 2.9%. Sports cars again were the lone exception, this time with a 1.4% increase from March.
Retail Supply Normal in Mid-April
Using estimates based on vAuto data as of April 10, used retail days’ supply was 40 days, which was unchanged from the end of March. Days’ supply was down nine days year over year and unchanged compared with the same week in 2019. Leveraging Manheim sales and inventory data, we estimate that wholesale supply ended March at 22 days, down two days from the end of February and down one day year over year. As of April 15, wholesale supply was at 24 days, up two days from the end of March, unchanged year over year, and three days lower than in 2019. Used supply measured in days’ supply and compared to 2019 suggests supply is close to normal for this time of year, which indicates demand and supply are relatively balanced despite low inventory levels.
Rental Risk Prices Increase Significantly in First Two Weeks of April
The average price for rental risk units sold at auction in the first 15 days of April was up 5.1% year over year. Rental risk prices were up 2.4% compared to the full month of March. Average mileage for rental risk units in the first half of April (at 58,700 miles) was down 8.8% compared to a year ago and down 9.4% month over month.
Tax Refunds in 2023 Down Compared to Last Year in All Key Metrics
While the 2023 tax refund season started faster than last year in terms of distribution of refunds, 2023 is now behind 2022 on all key metrics. With statistics through the week ending April 7, $199 billion in refunds have been issued. The number of refunds issued is down 1% from last year, 11% less has been disbursed than last year, and the average refund at $2,878 is down 9% year over year.
The complete suite of monthly MUVVI data for April will be released on May 5, 2023, the fifth business day of the month, as regularly scheduled.
For questions or to request data, please email manheim.data@coxautoinc.com. If you want updates about the Manheim Used Vehicle Value Index, as well as direct invitations to the quarterly call sent to you, please sign up for our Cox Automotive newsletter and select Manheim Used Vehicle Value Index quarterly calls. The next call is scheduled for Monday, July 10, at 11 a.m. EDT.
Note: The Manheim Used Vehicle Value Index was adjusted to improve accuracy and consistency across the data set as of the January 2023 data release. The starting point for the MUVVI was adjusted from January 1995 to January 1997. The index was then recalculated with January 1997 = 100, whereas prior reports had 1995 as the baseline of 100. All monthly and yearly percent changes since January 2015 are identical. Learn more about the decision to rebase the index.


