Data Point
Wholesale Used-Vehicle Prices Increase in First Half of May From Seasonal Adjustment
Tuesday May 17, 2022
Article Highlights
- Wholesale used-vehicle prices (on a mix-, mileage-, and seasonally adjusted basis) increased 0.7% in the first 15 days of May compared to the full month of April.
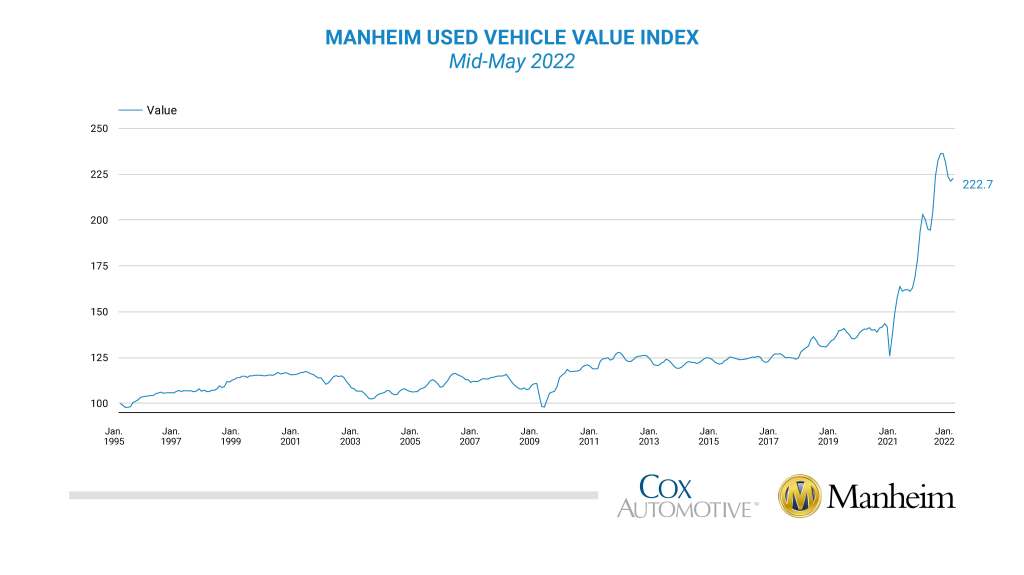
- This brought the Manheim Used Vehicle Value Index to 222.7, which was up 9.7% from May 2021.
- The non-adjusted price in the first two weeks of May increased 1.0% compared to the full month of April.
Wholesale used-vehicle prices (on a mix-, mileage-, and seasonally adjusted basis) increased 0.7% in the first 15 days of May compared to the full month of April. This brought the Manheim Used Vehicle Value Index to 222.7, which was up 9.7% from May 2021. The non-adjusted price change in the first half of May was an increase of 1.0% compared to April, leaving the unadjusted average price up 12.1% year over year.
Manheim Market Report (MMR) prices saw decreasing, but positive gains over the first two full weeks of May. The Three-Year-Old MMR Index, which represents the largest model-year cohort at auction, experienced a 0.3% cumulative increase over the last two weeks. Over the first 15 days of May, MMR Retention, which is the average difference in price relative to current MMR, averaged 98.7%, which indicates that valuation models are slightly ahead of market prices. The average daily sales conversion rate of 57.8% in the first half of May was flat relative to April’s daily average of 57.9% and has been slightly lower than the typical conversion rate this time of year. The latest trends in the key indicators suggest wholesale used-vehicle values may see increases in the second half of the month.
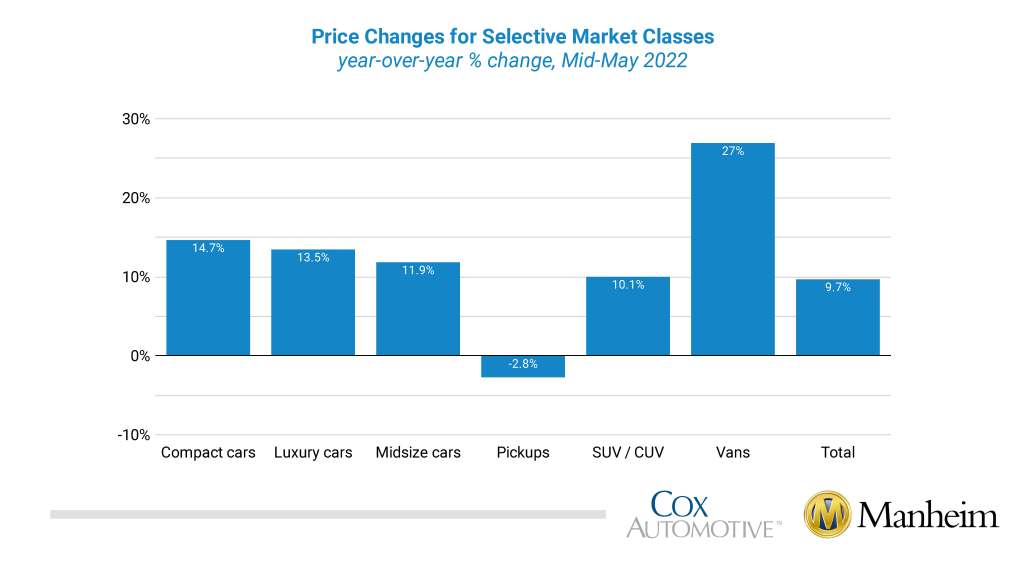
Most major market segments saw seasonally adjusted prices that were higher year over year in the first half of May. Pickups were the exception, with a 2.8% decline year over year. Vans had the largest increase at 27.0%, and both non-luxury car segments outpaced the overall industry in seasonally adjusted year-over-year gains. Compared to April, major segment performance was mixed, with half seeing seasonally adjusted price increases, while other segments saw declines and full-size cars declined the most. The seasonal adjustment drove the declines, as all major market segments saw gains from April, with vans increasing the most and pickups increasing the least.
Wholesale supply nearly flat in May. Using estimates based on vAuto data as of May 15, used retail days’ supply was 49 days, which was down three days from the end of April. Days’ supply was up 12 days year over year. Leveraging Manheim sales and inventory data, we estimate that wholesale supply ended April at 25 days, flat from the end of March but up seven days year over year. As of May 15, wholesale supply was at 24 days, down one day from the end of April but up six days year over year.
Rental risk prices increase. The average price for rental risk units sold at auction in the first 15 days of May was up 30.9% year over year. Rental risk prices were up 3.0% compared to the full month of April. Average mileage for rental risk units in the first half of April (at 62,900 miles) was down 28.7% compared to a year ago and down 2.4% month over month.
Consumer Sentiment declines from April. The initial March reading on Consumer Sentiment from the University of Michigan declined 9.4% to 59.1 from 65.2 in April. Consumers’ views of both current conditions and future expectations declined similarly. The expected inflation rate was stable. Consumers’ views of buying conditions for vehicles declined to the lowest reading this year. The daily index of consumer sentiment from Morning Consult has also declined so far in May. As of today, the index was down 0.4% week over week, leaving the index down 2.1% for the month so far.
The complete suite of monthly MUVVI data for May will be released on June 7, 2022, the fifth business day of the month as regularly scheduled. If you have any questions regarding the Index or would like to sign up for updates, please contact the Cox Automotive Industry Insights team at Manheim.Data@coxautoinc.com.