
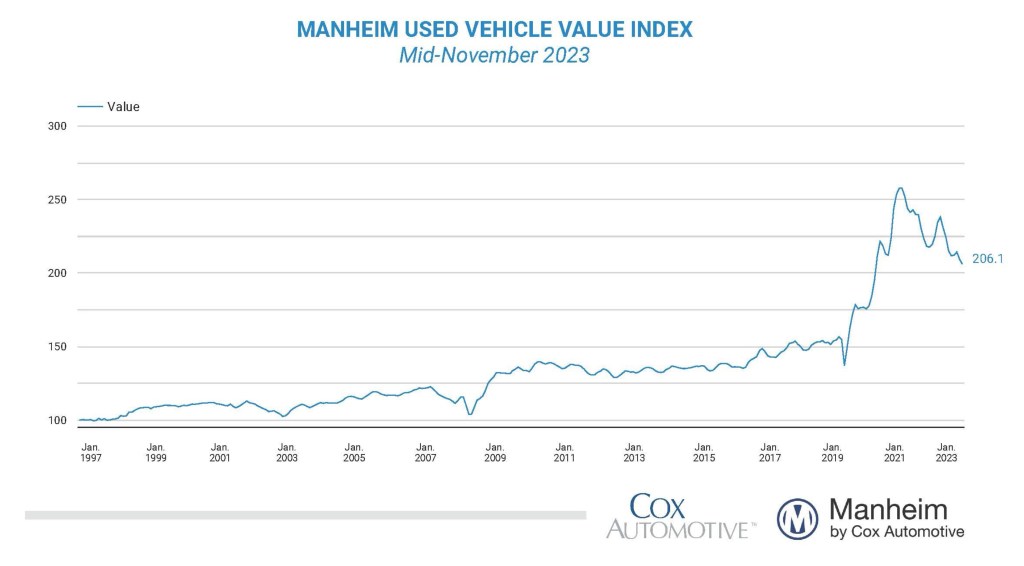
Wholesale used-vehicle prices (on a mix-, mileage-, and seasonally adjusted basis) decreased 1.6% from October in the first 15 days of November. The midmonth Manheim Used Vehicle Value Index declined to 206.1, which was down 5.3% from the full month of November 2022. The seasonal adjustment reduced the decrease. The non-adjusted price change in the first half of November dropped 2.3% compared to October, while the unadjusted price was down 6.9% year over year.
Over the last two weeks, Manheim Market Report (MMR) prices declined an aggregate of 1.9%, which was more than the normal decline of 1.0% for the time of year. Over the first 15 days of November, MMR Retention, the average difference in price relative to current MMR, averaged 98.8%, indicating that valuation models are ahead of market prices. The average daily sales conversion rate of 52.8% in the first half of November was above the November 2019 daily average of 50.8%. The conversion rate indicates that the first 15 days of the month saw slightly stronger-than-normal buying demand for this time of year.
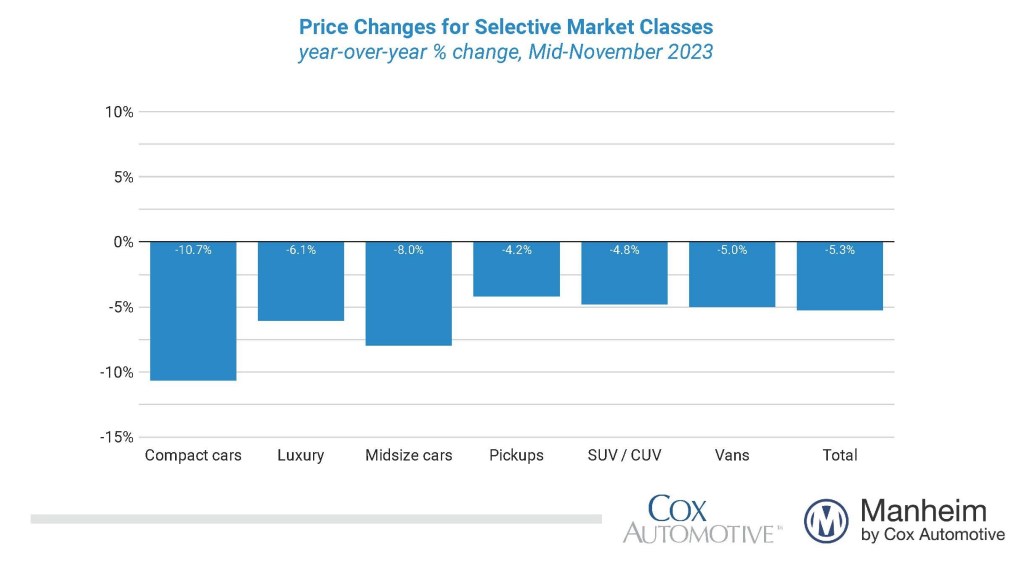
All major market segments saw seasonally adjusted prices that were again lower year over year in the first half of November. Pickups, SUVs, and vans lost less than the industry’s year-over-year decline of 5.3%, at 4.2%, 4.8%, and 5.0%, respectively. Compact cars continued to slide, down 10.7%, midsize cars were off by 8.0%, and luxury lost 6.1% year over year. Most major segments saw negative price performance compared to October, with luxury the only gainer, up 0.3% in a down month. Pickups lost 2.8%, midsize cars were down 2.1%, and SUVs were equal to the industry, with a 1.6% decline. Compact cars and vans, down 1.3% and 0.7%, lost less than the industry in month-over-month declines.
Wholesale Supply Unchanged in Mid-November
Leveraging Manheim sales and inventory data, we estimate that wholesale supply ended October at 27 days, up one day from the end of September and flat year over year. As of Nov. 15, wholesale supply was unchanged from the end of October at 27 days, down one day year over year and down three days compared to 2019. Wholesale supply is tighter than normal for this time of year.
Rental Risk Prices and Mileage Declined in First Two Weeks of November
The average price for rental risk units sold at auction in the first 15 days of November was down 6.3% year over year. Rental risk prices were down by 4.7% compared to the full month of October. Average mileage for rental risk units in the first half of November (at 47,200 miles) was down 12.7% compared to a year ago and down 6.7% month over month.
Measures of Consumer Sentiment Mixed to Start November
The initial November reading on Consumer Sentiment from the University of Michigan declined 5.3% to 60.4, as views of both current conditions and future expectations declined. Worries about inflation are again driving much of the decline as the median expected inflation rate over the next year increased to 4.4% from 4.2% last month, and the longer-term view increased to 3.2% from 3.0%. That five-year view of inflation was the highest since 2008 and is worrisome as it suggests consumers are anchoring to a persistent level of higher inflation. Consumers’ views of vehicle-buying conditions declined to the worst level so far this year. The daily index of consumer sentiment from Morning Consult tells a slightly different story, including the daily readings from this week. As of Nov. 16, that index has increased 0.7% in November. The improvement in the daily gauge of consumer sentiment aligns with average gas prices’ declining 3.5% so far this month to the lowest levels since early January.
The complete suite of monthly MUVVI data for October will be released on Dec. 7, 2023, the fifth business day of the month, as regularly scheduled.
For questions or to request data, please email manheim.data@coxautoinc.com. If you want updates about the Manheim Used Vehicle Value Index, as well as direct invitations to the quarterly call sent to you, please sign up for our Cox Automotive newsletter and select Manheim Used Vehicle Value Index quarterly calls.
Note: The Manheim Used Vehicle Value Index was adjusted to improve accuracy and consistency across the data set as of the January 2023 data release. The starting point for the MUVVI was adjusted from January 1995 to January 1997. The index was then recalculated with January 1997 = 100, whereas prior reports had 1995 as the baseline of 100. All monthly and yearly percent changes since January 2015 are identical. Learn more about the decision to rebase the index.


