
Wholesale used vehicle prices (on a mix-, mileage-, and seasonally adjusted basis) decreased 1.04% month-over-month in September. This brought the Manheim Used Vehicle Value Index to 139.9, flat from a year ago and off the record high for the Index.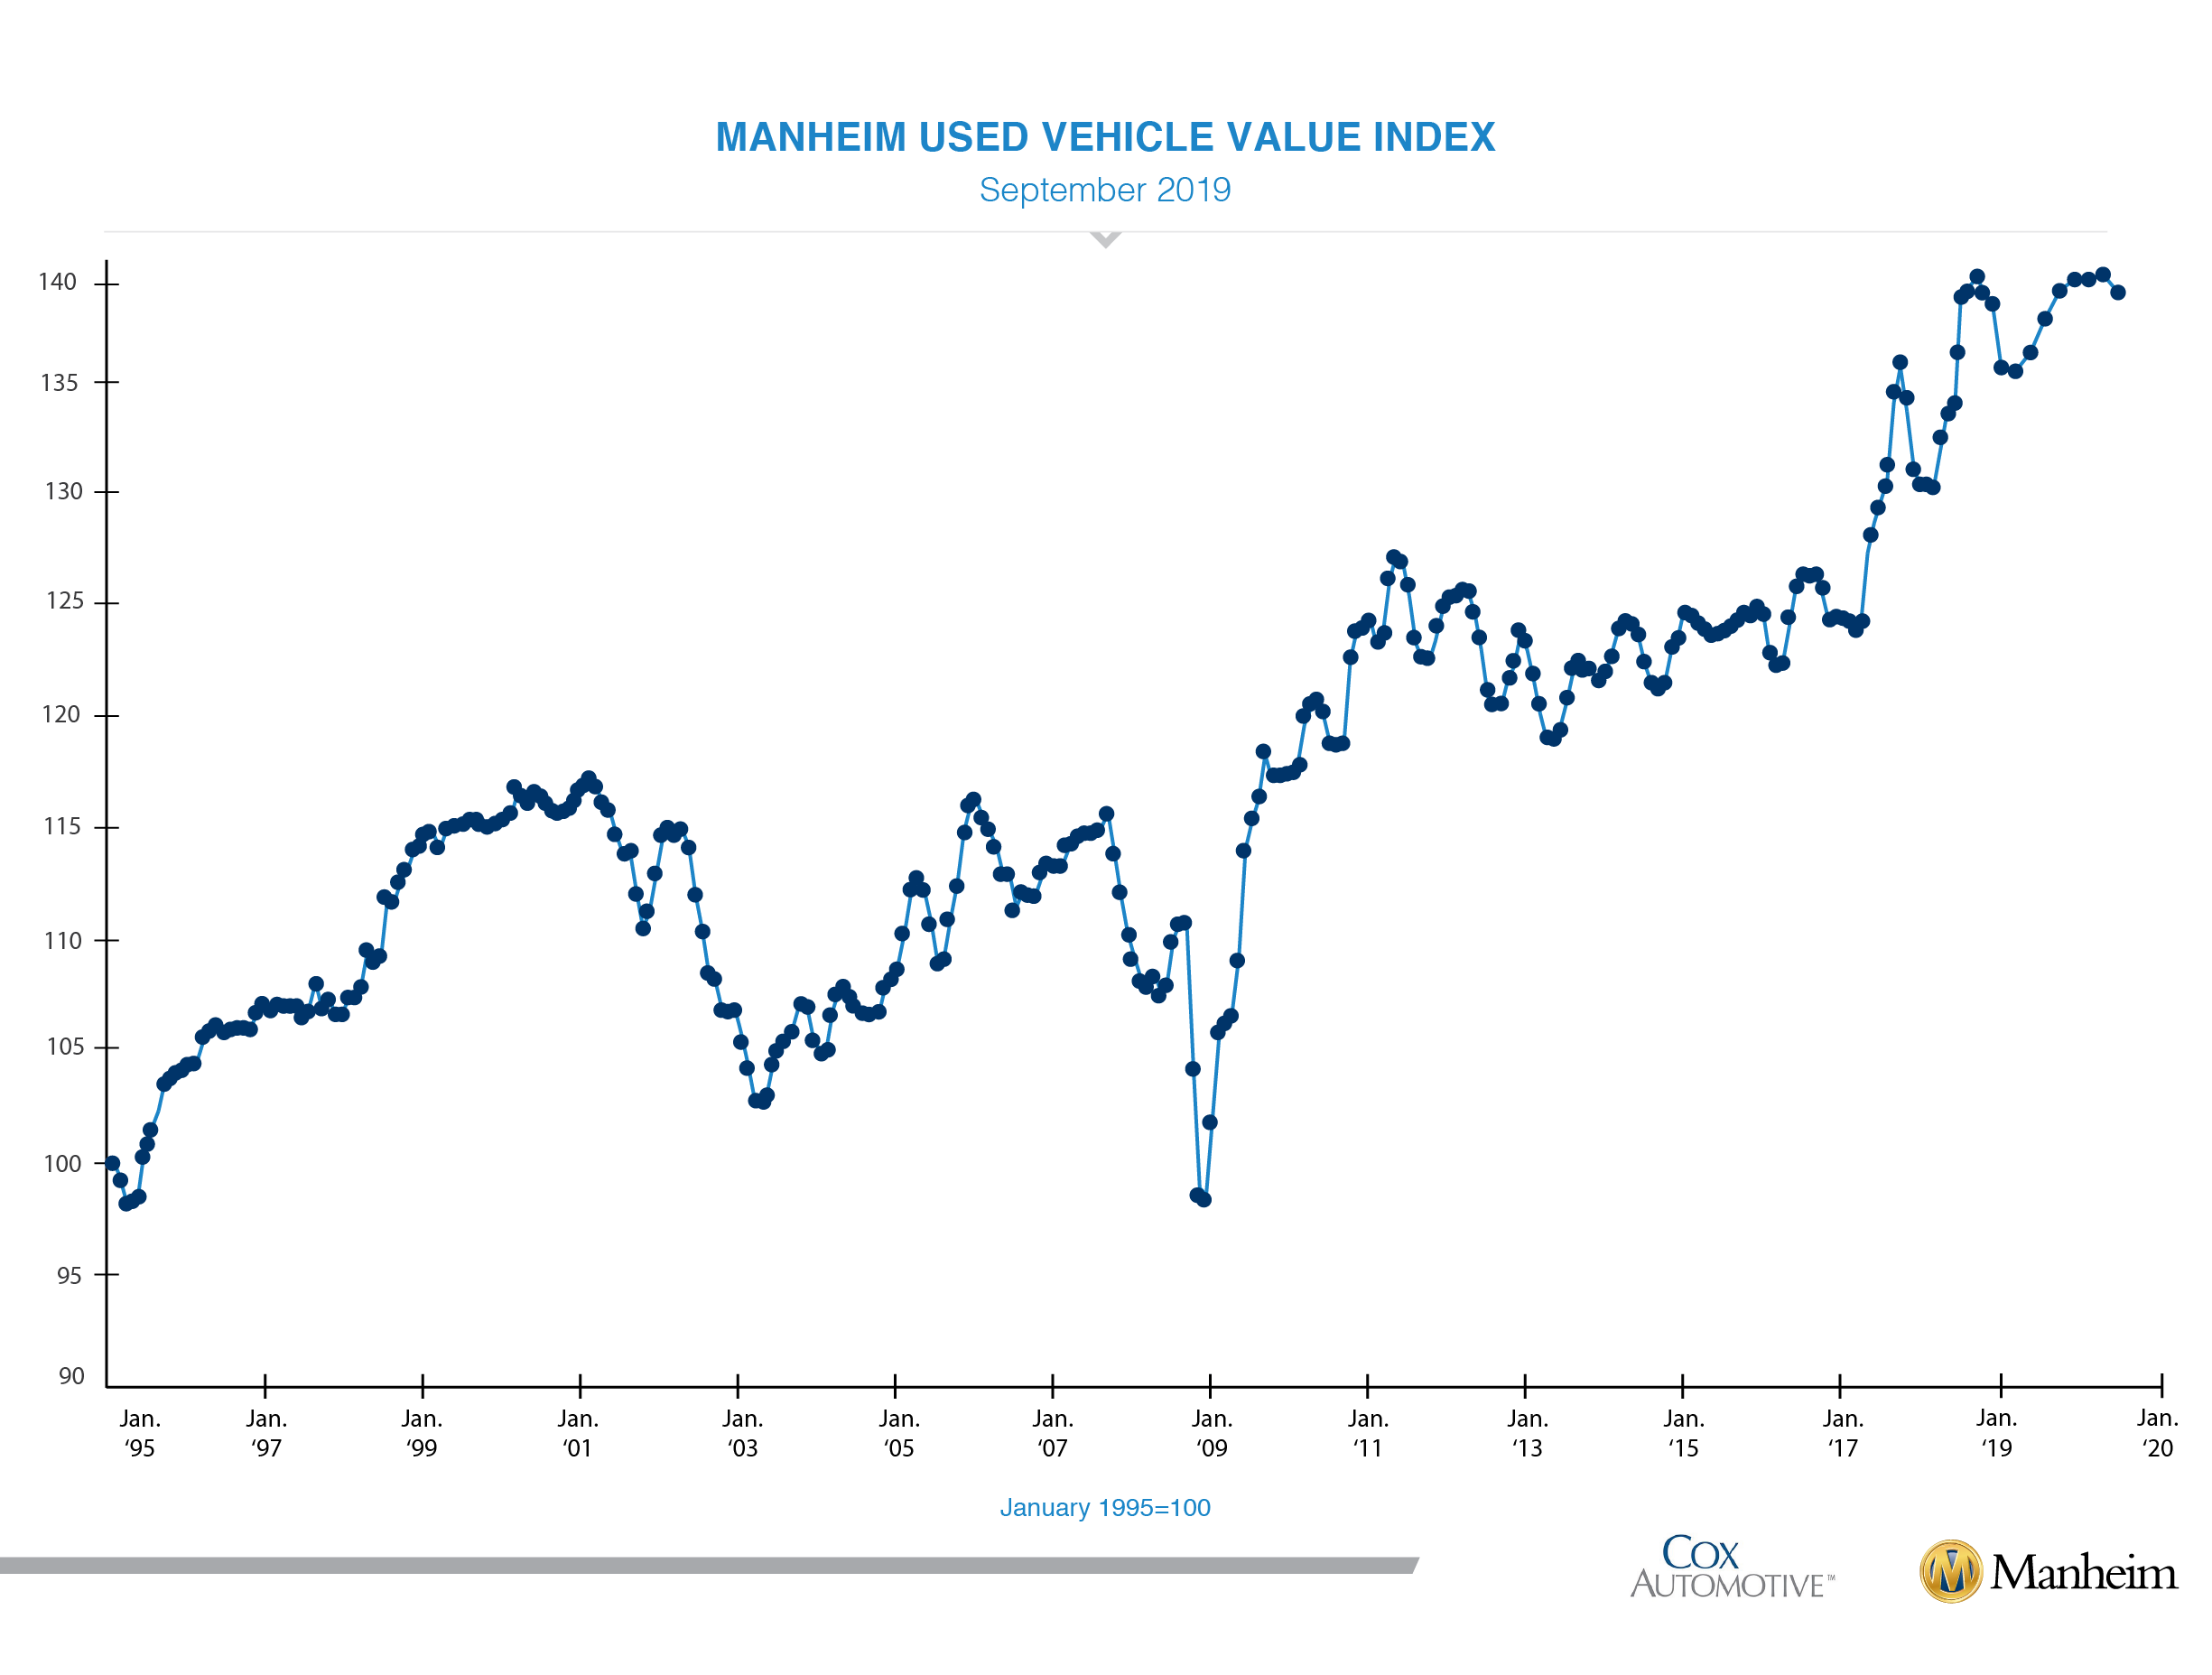
Weekly Manheim Market Report (MMR) prices showed increasing depreciation as September progressed. The majority of the summer had low depreciation, before the accelerating depreciation pattern marked an abrupt shift in season. The weekly pattern most resembled the pattern from last October, when prices began to normalize following an abnormally strong summer and early fall. Three-year-old vehicle values in aggregate were down 2.6% for the month, when prices normally decline by 1.5%. As a result of this higher depreciation, prices in aggregate in non-luxury ended lower than the beginning of the year for the first time since March.
On a year-over-year basis, major market segments saw weak seasonally adjusted price gains in September. Luxury cars and vans outperformed the overall market, while most other major segments underperformed the overall market. Last year continues to be a tough comparison for both prices and sales as we experienced an abnormal increase in consumer demand driven by tariff fears and rising interest rates.
Weak retail results for vehicle sales year-over-year. According to Cox Automotive estimates, total used vehicle sales volume was down 0.1% year-over-year in September. We estimate the September used SAAR to be 39.8 million, up from 39.7 million last September and flat from August’s rate. The September used retail SAAR estimate is 20 million, up from 19.6 million last September and flat month-over-month. [See more details on the 13-month rolling used-vehicle SAAR.]
September total new vehicle sales were down 11.3% year-over-year, with two fewer selling days compared to September 2018 and did not include Labor Day weekend. The September SAAR came in at 17.2 million, a decline from last year’s 17.3 million and up slightly from August’s 17.0 million rate. The decline in sales represented by sedans seems to be bottoming out as car share in September was 27%.
Strong fleet sales continue to support the new vehicle market. Combined rental, commercial, and government purchases of new vehicles were down 7.3% year-over-year in September. The commercial fleet channel was particularly strong, up 18% year-over-year in September. Even with the highest average incentive in 21 months, retail sales of new vehicles were down 12% in September, leading to a retail SAAR of 14.6 million, down from 14.8 million last September and the weakest retail SAAR over the last three months. Fleet sales are up 5.8% in 2019 through September, and retail sales are down 2.5%, as the overall new vehicle market is down 1.1% this year.
New vehicle inventories came in under 4 million units for the fifth consecutive month but increased month-over-month.
Rental risk pricing declines. The average price for rental risk units sold at auction in September was down 0.7% year-over-year. Rental risk prices were down 0.9% compared to August. Average mileage for rental risk units in September (at 46,900 miles) was up 6% compared to a year ago but down 2% month-over-month.
Declining consumer confidence among mixed conditions. Second-quarter economic growth as measured by GDP was left unchanged at 2.0% in the third and final estimate. The first half of the year delivered 2.6% growth relative to 3% growth in the first half of 2018. The Fed has revised its forecast for the year down to 2.2% growth from 2.9% growth last year, which implies further slowing in the back half of the year. Consumer Confidence, as measured by the Conference Board, declined substantially in September by 6.8% to 125.1, which was the lowest reading in three months. Declines in both the assessment of the present situation and forward-looking expectations pulled the aggregate index down. In the Conference Board data, the percentage of households reporting plans to purchase a vehicle in the next six months declined to its lowest level in 14 months in September. Purchase intentions are now lower than last year.
The Manheim Used Vehicle Value Index data file is available for download.


