Commentary & Voices
July Manheim Used Vehicle Value Index: Used Vehicle Values Increase to New Record
Tuesday August 7, 2018
Article Highlights
- Wholesale used vehicle prices (on a mix-, mileage-, and seasonally adjusted basis) increased 1.51% month-over-month in July.
- This brought the Manheim Used Vehicle Value Index to 136.9, which was a 5.1% increase from a year ago and the highest level ever for the series.
- Looking at trends in weekly Manheim Market Report (MMR) prices, the abnormal summer bounce that started in June continued and strengthened in July. Correspondingly, the best-selling cars at Manheim are worth more today than a month ago, and many vehicles are worth more now than a year ago. Price comparisons to last year will be tougher through the rest of the year; but recent weekly increases were higher than last year, keeping current price performance ahead of last year.
Wholesale used vehicle prices (on a mix-, mileage-, and seasonally adjusted basis) increased 1.51% month-over-month in July. This brought the Manheim Used Vehicle Value Index to 136.9, which was a 5.1% increase from a year ago and the highest level ever for the series.
Looking at trends in weekly Manheim Market Report (MMR) prices, the abnormal summer bounce that started in June continued and strengthened in July. Correspondingly, the best-selling cars at Manheim are worth more today than a month ago, and many vehicles are worth more now than a year ago. Price comparisons to last year will be tougher through the rest of the year; but recent weekly increases were higher than last year, keeping current price performance ahead of last year.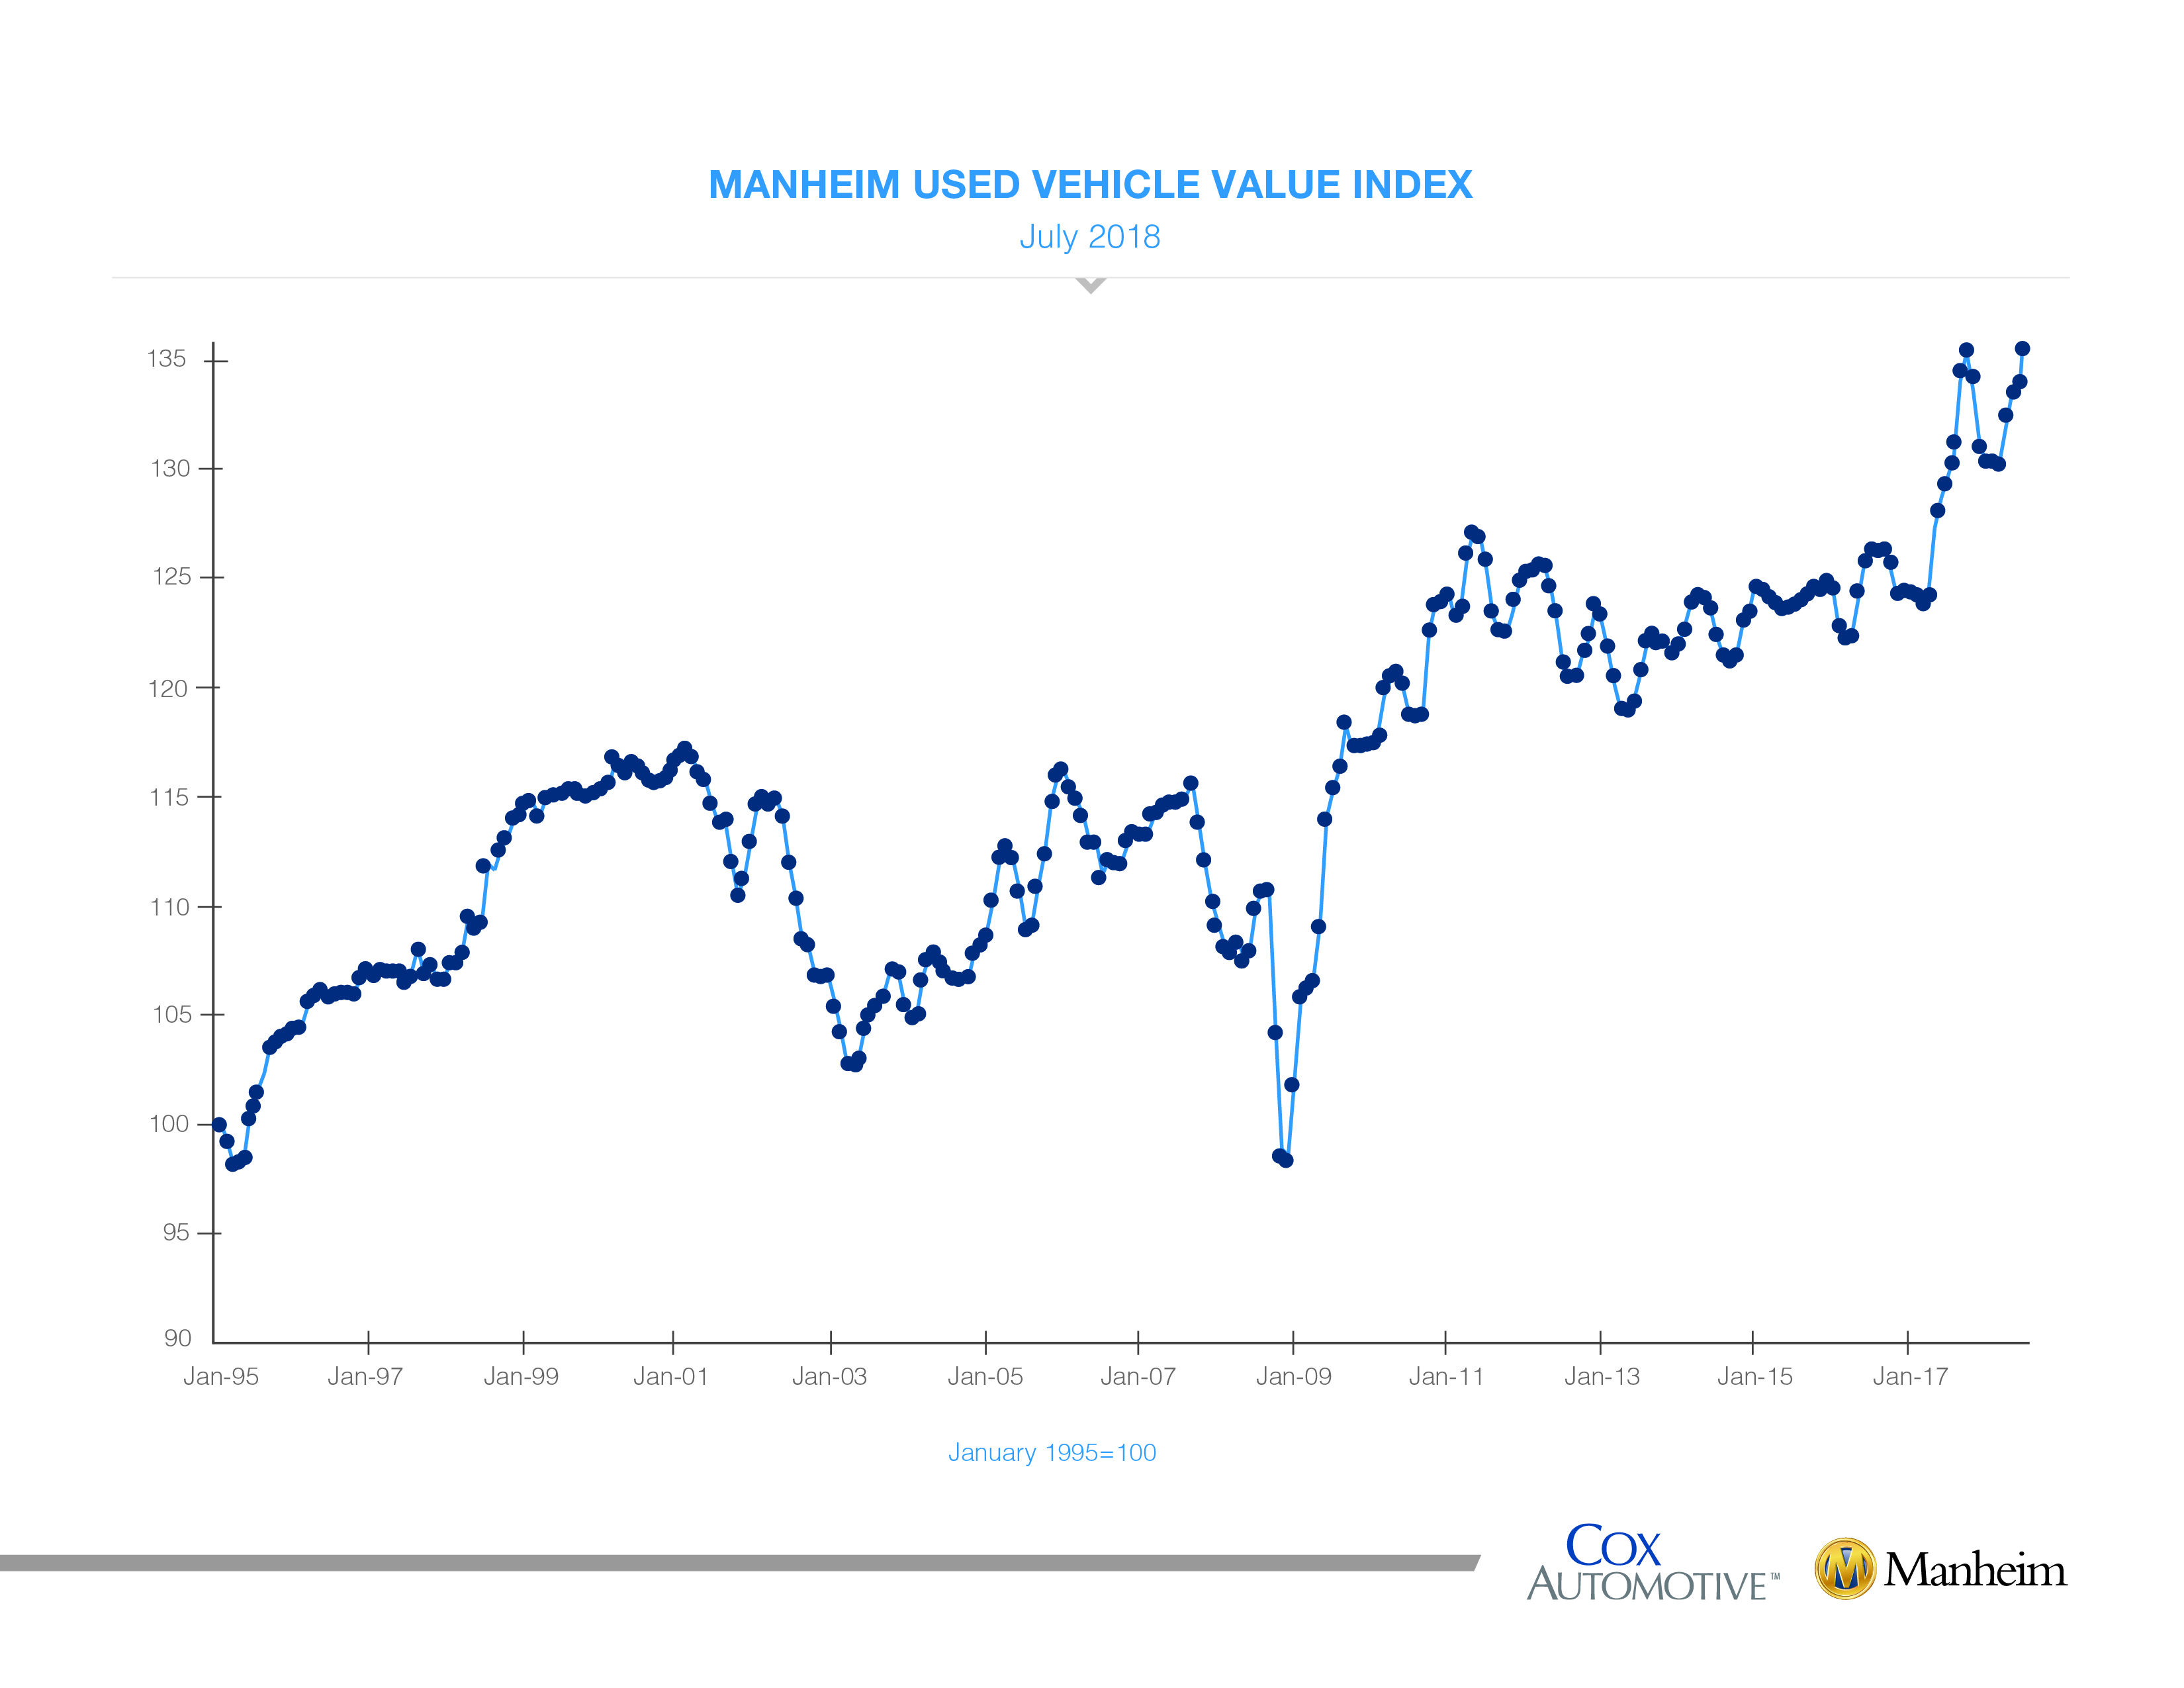 The strange summer price appreciation in used cars is partly a function of a strong economy at its peak, with mounting affordability challenges for the consumer that favor growth in used vehicle sales at the expense of new. These conditions have supported strong used vehicle prices for over a year. The catalyst for even stronger price movement this summer is the fear of import tariffs’ leading to higher prices in the future. Higher prices and the related declining level of supply create a psychological feedback loop for consumers, encouraging buying now with the expectation that prices may be higher later.
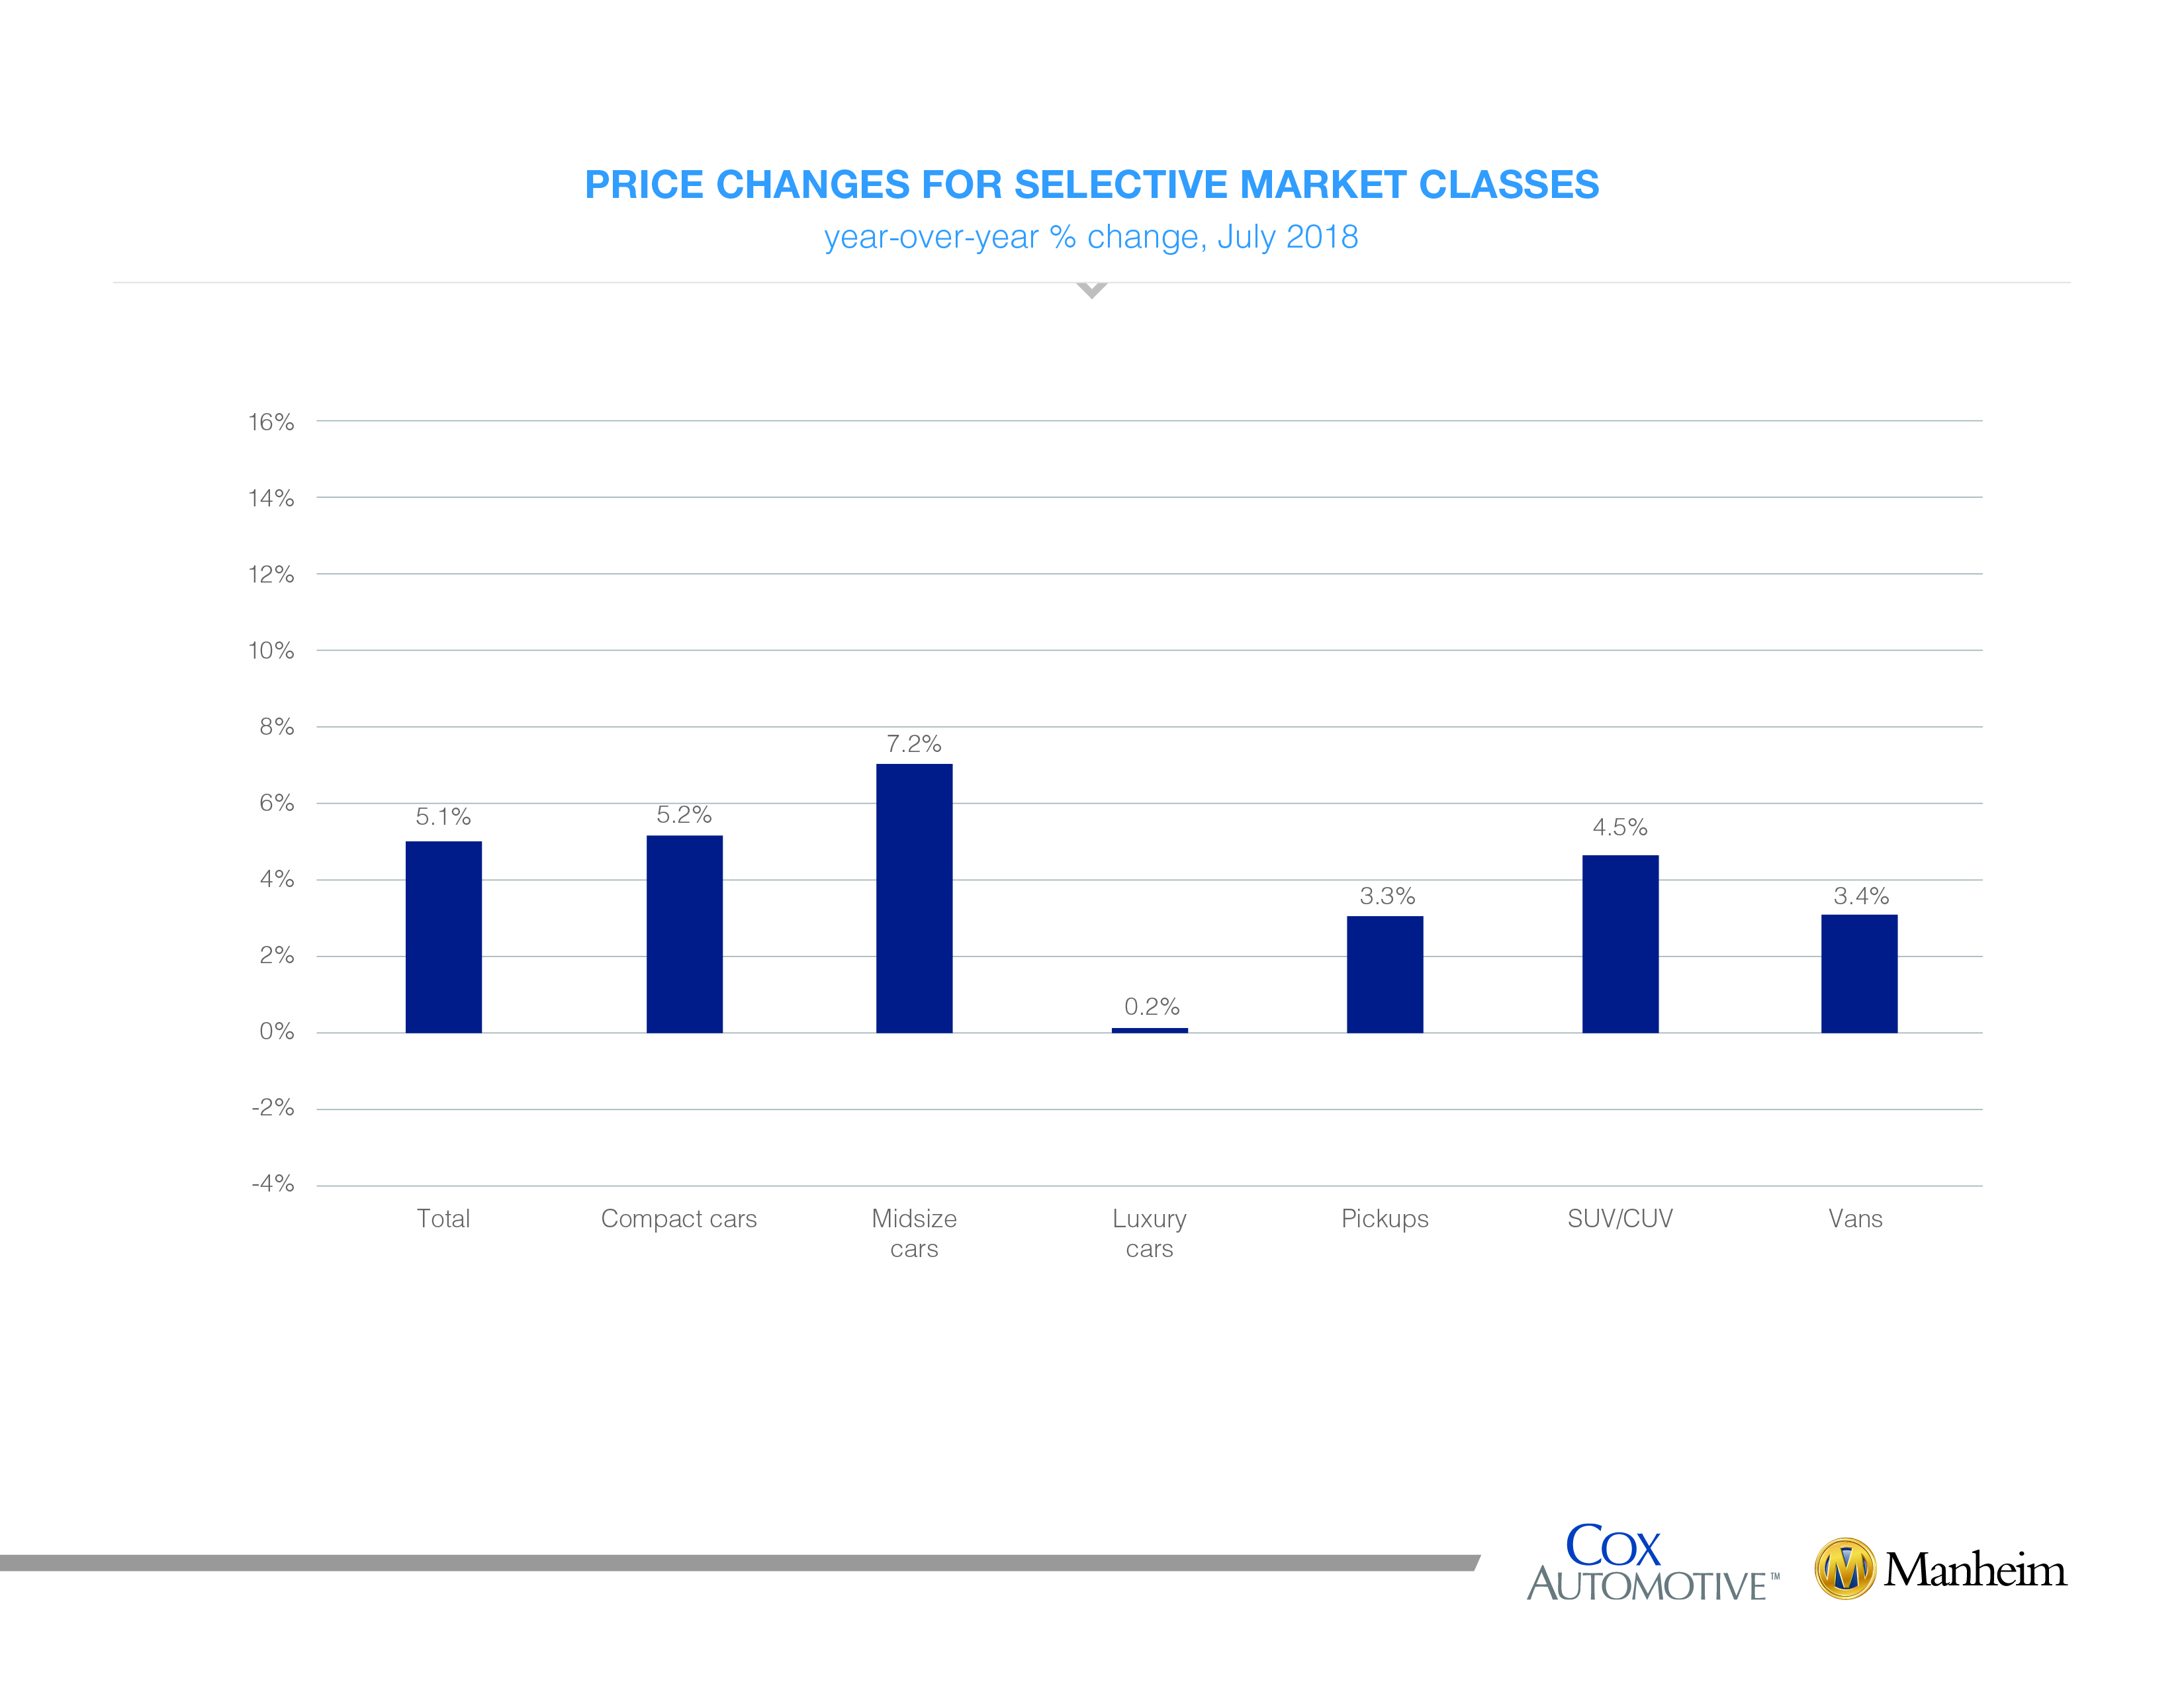 On a year-over-year basis, all major market segments saw price gains in July; but more affordable vehicles are seeing the greatest increases in values. Compact cars and midsize cars outperformed the overall market, while vans, utility vehicles, and pickups underperformed the overall market.
Mixed results for vehicle sales in July. According to Cox Automotive estimates, used vehicle sales volume increased by 3% year-over-year in July. The annualized pace of used vehicle sales is up 1% over last year led by franchised used vehicle sales (up 2% in July on an annualized-basis) and private party used vehicle sales (up 4% in July on an annualized basis). We estimate the July used SAAR to be 39.2 million, the strongest July reading in six years.
July new vehicle sales decreased 3% year-over-year, with one less selling day compared to July 2017. July SAAR came in at 16.7 million, flat versus last year’s 16.7 million. July is just the second month this year to have new vehicle SAAR come in under 17 million. Cars continue to see sharp declines as sales in July fell 17% compared to last year. Light trucks outperformed cars in July and were up 4% year-over-year. New vehicle sales year-to-date are up 1% versus last year.
Fleet has been the driver of the strength in the new vehicle market year-to-date, but fleet purchases declined in July relative to June. Despite the decline, the volume of fleet sales was up 26% year-over-year and 9% year-to-date. Retail sales are down 0.2% year-to-date; but ironically, July saw the strongest retail SAAR (14.7 million) for the year.
New vehicle inventories came in under 4 million units for the third consecutive month and are at the lowest level in 23 months.
Rental risk pricing strengthens. The average price for rental risk units sold at auction in July was up 6% year-over-year. Rental risk prices were up 1% compared to June. Average mileage for rental risk units in July (at 45,200 miles) was up 9% compared to a year ago and up 6% month-over-month.
Continued strong economic momentum. The first estimate of second-quarter real GDP growth came in at 4.1%, which was much better than the trailing 14-quarter average of 2.1%. Consumer spending drove the strong quarter with a 4.0% increase, rebounding from an anemic increase of only 0.5% in the first quarter. Consumer sentiment fell in July to the lowest level since January. According to the University of Michigan, the decline in sentiment is being driven by consumers with negative concerns about tariffs becoming more pessimistic in their economic outlook. Meanwhile, the job market continues to be solid as robust job creation this year has pushed unemployment to near record lows.
The Manheim Used Vehicle Value Index data file is available. Download here›
For more details, visit the Manheim Consulting site: https://publish.manheim.com/en/services/consulting/used-vehicle-value-index.html