Data Point
Year-To-Date Fleet Sales Outpace 2020
Thursday November 4, 2021
Article Highlights
- In October, 100,182 total fleet units were sold, a 2% month-over-month increase.
- This brings the 2021 year-to-date total combined large rental, commercial, and government purchases of new vehicles to 1.39 million units, a 1% increase from this time in 2020.
- Nissan saw the largest growth last month with more than 5,000 deliveries with Hyundai seeing the largest decrease compared to October 2020.
In October, 100,182 total fleet units were sold, a 2% month-over-month increase compared to 98,415 in September and a 24% decrease from October 2020, which recorded 132,560 units. This brings the 2021 year-to-date total combined large rental, commercial, and government purchases of new vehicles to 1.39 million units, a 1% increase from this time in 2020 when 1.38 million units were sold and a 42% decrease from the same time in 2019 when 2.4 million units were sold.
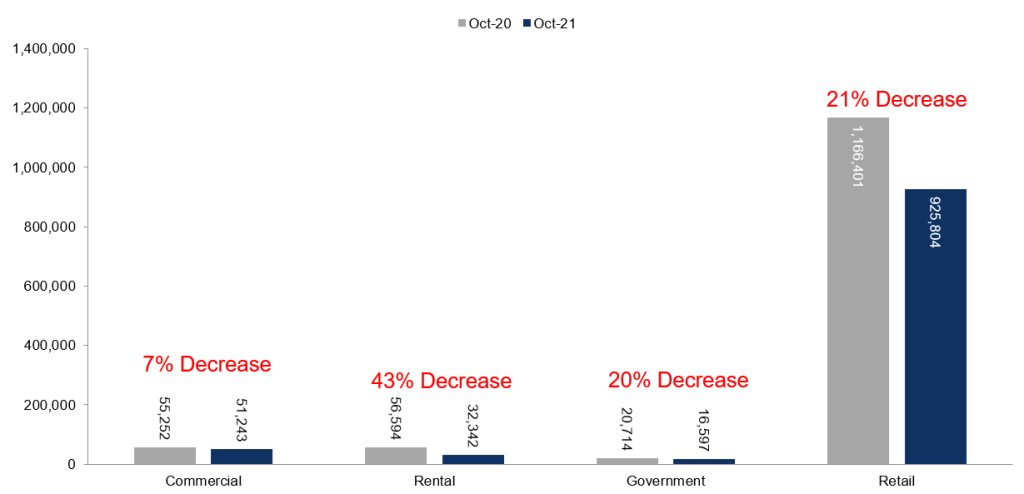
Fleet Sales – October 2020 Versus October 2021

Combined sales into large rental, commercial, and government buyers were down 24% year over year in October. Sales into rental decreased 43% year over year in October but are up 2% year to date through last month compared to the same time period last year. Commercial sales are down 7% year over year in October and are up 11% year to date in 2021 versus 2020. Including an estimate for fleet deliveries into the dealer and manufacturer channel, we estimate that the remaining retail sales were down 21% year over year in October, leading to an estimated retail SAAR of 11.5 million, which was down from 14.1 million last October and down from October 2019’s 13.5 million rate.
October total new-vehicle sales were down 23% year over year, with one less selling day compared to October 2020. Month over month, October new-vehicle sales were up 4%. The October seasonally adjusted annual rate (SAAR) came in at 13.0 million, a decrease from last year’s 16.4 million and October 2019’s 16.7 million rate.
Looking at automakers, year-over-year changes in fleet sales differed by manufacturer, ranging from a decline of 69% to an increase of 22%. Nissan saw the largest growth last month with more than 5,000 deliveries with Hyundai seeing the largest decrease compared to October 2020.
