Data Point
Wholesale Used-Vehicle Prices Decrease in May
Friday June 6, 2025
Wholesale used-vehicle prices (on a mix, mileage, and seasonally adjusted basis) were lower in May compared to April. The Manheim Used Vehicle Value Index (MUVVI) declined to 205.2, representing a 4% increase from the same time last year and a 1.4% decline from April levels. The seasonal adjustment slightly lowered the decline seen in the month, as non-seasonally adjusted values fell more than usual following the strong increase in April related to the tariff announcement. The non-adjusted price in May decreased by 1.5% compared to April, resulting in an unadjusted average price that was 4% higher year over year.
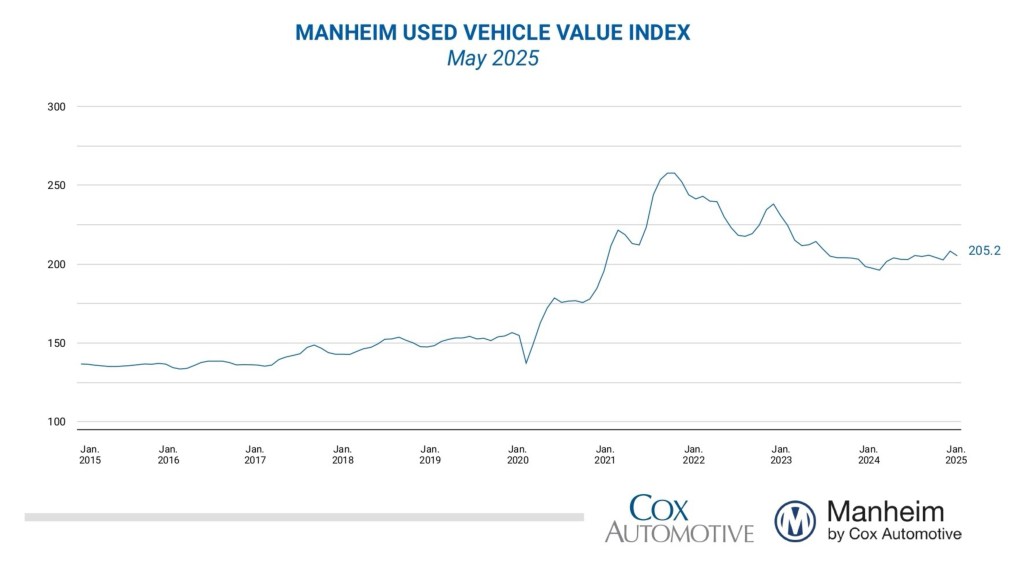
“Wholesale appreciation trends were remarkably strong in April, but the market gave some of that strength back in May, though values remain well above last year’s levels,” said Jeremy Robb, senior director of Economic and Industry Insights at Cox Automotive. “Weekly wholesale depreciation trends were stronger than usual in the middle of the month but slowed down in the last week of May, with values aligning with the long-term run rates. The used retail days’ supply remains down 5% compared to last year’s levels, which is seasonally tighter than normal, as wholesale days’ supply at Manheim is also currently down 5%. While the market continues to digest the impact of tariffs, we could see a bit higher levels of wholesale depreciation over the summer. However, lower inventory levels may counterbalance those more aggressive depreciation trends in the coming months.”
In May, Manheim Market Report (MMR) values experienced price declines for each week of the month, with the lowest declines occurring in the last week. In that final week, values fell by only 0.2%, which was slightly lower than the depreciation rates mid-month. Over the previous four weeks, the Three-Year-Old Index decreased by an aggregate of 1.4%, which is somewhat lower than the usual rate. Those same weeks delivered an average decrease of 1.5% between 2014 and 2019, indicating depreciation trends were slightly lower than normally seen.
Over the month, the daily MMR Retention, which is the average difference in price relative to the current MMR, averaged 99.1%, indicating that market prices moved below MMR values this month and were lower compared to April levels. Against last year, valuation models were down by 0.3 percentage points (30 basis points) for MMR retention, and they are five-tenths of a point lower than 2019 levels for the same period. The average daily sales conversion rate fell to 57.4%, a decline of more than 5 percentage points from last month, though it is still higher than the usual rate for this time of year. For comparison, the daily sales conversion rate averaged 55.3% in May over the previous three years.
Major market segments were mostly higher for seasonally adjusted prices year over year in May, except for the compact car segment, which remained unchanged. Compared to May 2024, the luxury segment rose the most for the fourth consecutive month, increasing by 6.5%. SUVs came in second, with a 5.2% increase over the last year. Underperforming the industry, mid-size sedans increased by 1.2%, trucks rose by 0.3%, and compact cars showed the worst performance, falling by 1.5% compared to last year. Compared to the previous month, the luxury segment experienced the smallest decline, falling 0.7%, as SUVs decreased by 1.3%, outperforming the overall market. Mid-size sedans decreased 1.6%, while trucks were down 1.9%, and compact cars declined 2.3% in the period.
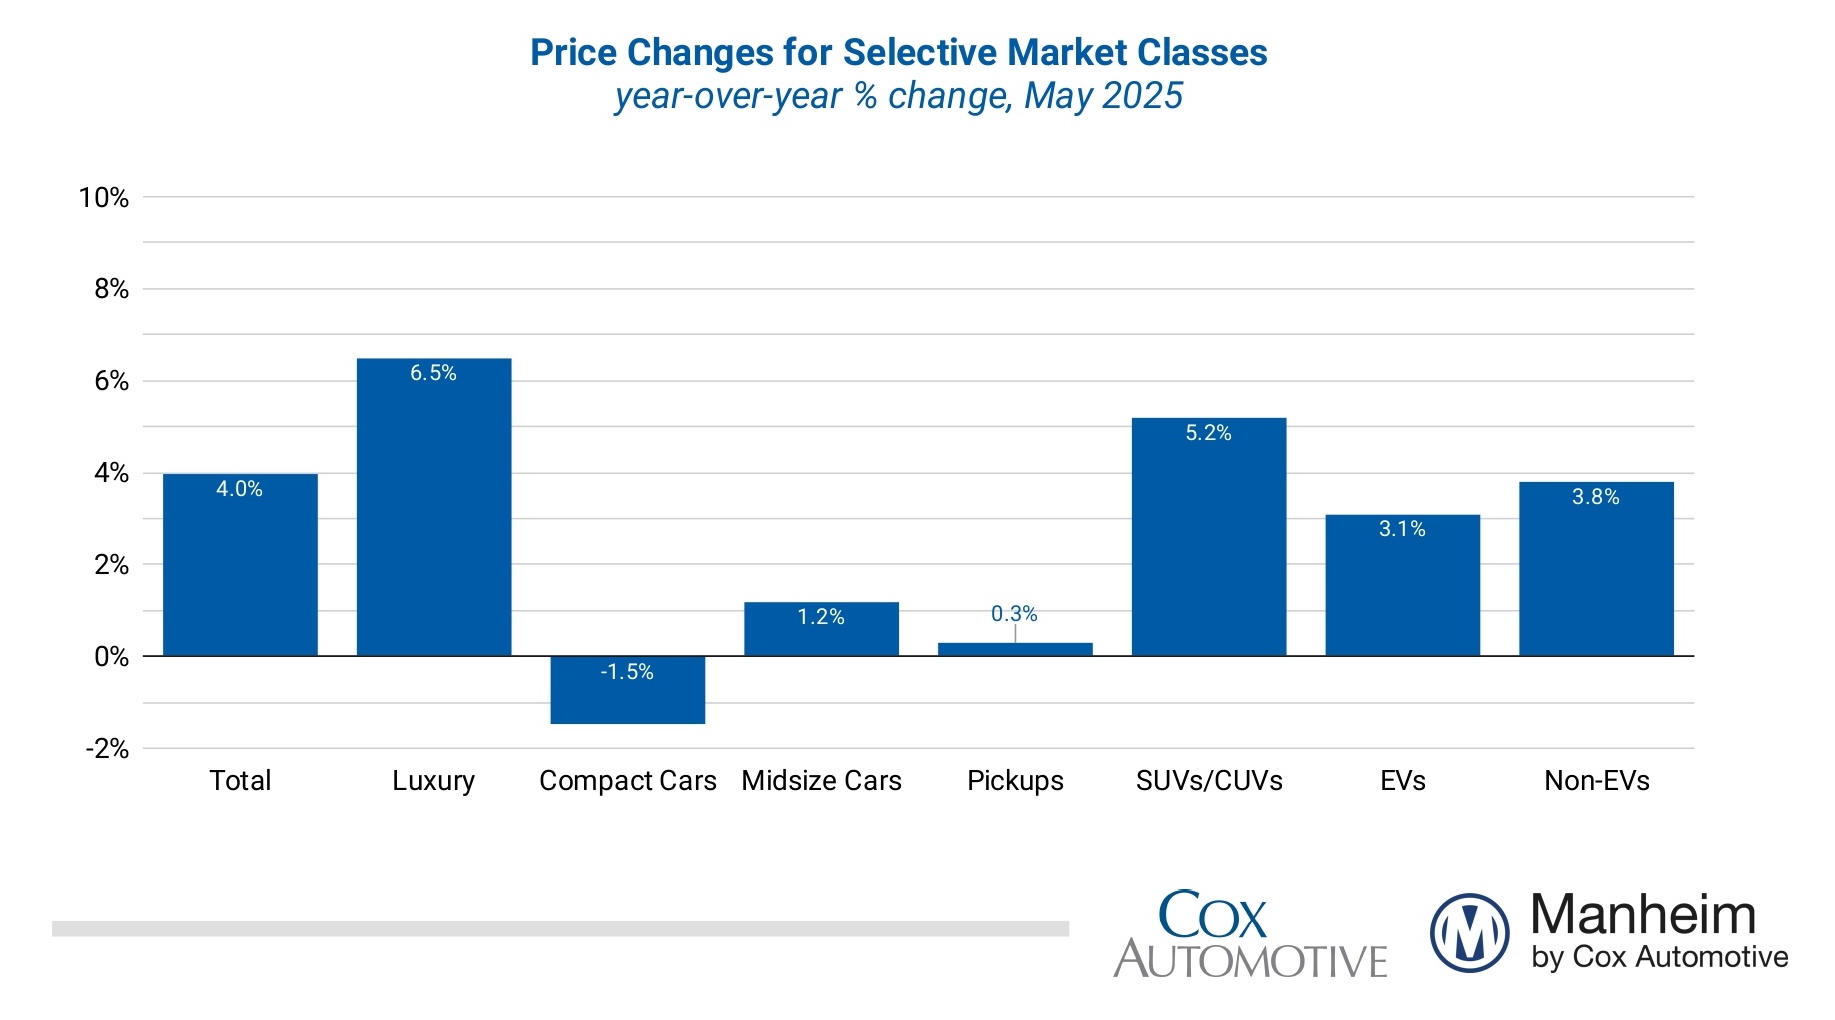
Looking at the market by powertrain, electric vehicle (EV) values increased by 3.1% compared to the same month in 2024, while non-EVs showed higher gains, rising by 3.8%. For May, EV values declined, but less than the market overall, falling by 0.9% compared to the prior month, while non-EVs declined 1.8% over the same period.
Retail Used-vehicle Sales Were Down in May
Assessing retail vehicle sales based on observed changes in units tracked by vAuto, initial estimates of retail used-vehicle sales in May were down 3% compared to April but up year over year by 4%. The average retail listing price for a used vehicle decreased 0.5% over the last four weeks.
Using estimates of retail used days’ supply based on vAuto data, an initial assessment indicates May ended at 44 days’ supply, up one day from 43 days at the end of April and down two days from May 2024 at 46 days.
New-vehicle sales in May were 2.5% higher than in the same month last year, and volume increased by only 0.3% from the very strong, tariff-induced April. The May sales pace, or seasonally adjusted annual rate (SAAR), came in at 15.6 million, down 0.2 million from last year’s pace and lower than the 17.3 million level in April.
Combined sales into large rental, commercial, and government fleets were essentially unchanged, rising just 0.1% year over year in May, as the increase in rental fleet sales was offset by weakness in government and commercial. Including an estimate for fleet deliveries into dealer and manufacturer channels, the remaining new retail sales were estimated to be up 5.5% from last year, leading to an estimated retail SAAR of 13.4 million, down from 14.7 million in April but up from 12.8 million last May. Fleet share was estimated to be 16.9%, down from last year’s 19.2% share.
Rental Risk, Price and Mileage Results Were Mixed Compared to Last May
The average price for rental risk units sold at auction in May increased by 6.7% year over year. Additionally, rental risk prices fell by 1.3% compared to April, yet remain higher than any other reading since June 2023. Average mileage for rental risk units in May (at 49,500 miles) fell 9.1% for the month against last year’s level, and average mileage was a bit higher against April’s levels, rising by 0.4% over the month.
Most Measures of Consumer Confidence Improved in May
The Conference Board Consumer Confidence Index® increased 14.4% in May, which was significantly better than the expected decline and was the best monthly improvement since March 2021. Consumers’ views of both the present and the future improved, but their views of the future jumped 31%. Consumer confidence was down 3.3% year over year. Plans to purchase a vehicle in the next six months improved to the highest level since December but were still slightly lower year over year. The sentiment index from the University of Michigan remained unchanged in May at 52.2, which was higher than expected and marked an increase from the initial reading at the beginning of the month. The index was down 24% year over year and had reached its lowest level since July 2022. The underlying views of current conditions declined, but future expectations improved. Expectations for inflation in one year increased to 6.6% from 6.5%, but expectations for inflation in five years decreased to 4.2% from 4.4%. Consumers’ views of buying conditions for vehicles improved slightly, as views of prices became less negative, and views of interest rates remained unchanged. The daily index of consumer sentiment from Morning Consult increased 7.1% in May, reversing much of the decline over the last three months and leaving the index up 10.7% year over year. According to AAA, the national average price for unleaded gas declined 5 cents in May from the end of April to $3.14 per gallon, which was down 11% year over year but up 2.6% year to date.
The next complete suite of monthly MUVVI data will be released on July 8, 2025. The Q2 MUVVI call will be held on July 8 at 11 a.m. EDT. Register to attend.
For questions or to request data, please email manheim.data@coxautoinc.com. If you want updates about the Manheim Used Vehicle Value Index, as well as direct invitations to the quarterly call sent to you, please sign up for our Cox Automotive newsletter and select Manheim Used Vehicle Value Index quarterly calls.
Note: The Manheim Used Vehicle Value Index was adjusted to improve accuracy and consistency across the data set as of the January 2023 data release. The starting point for the MUVVI was adjusted from January 1995 to January 1997. The index was then recalculated with January 1997 = 100, whereas prior reports had 1995 as the baseline of 100. All monthly and yearly percent changes since January 2015 are identical. Learn more about the decision to rebase the index.