
Wholesale used-vehicle prices (on a mix-, mileage-, and seasonally adjusted basis) decreased 0.9% from January in the first 15 days of February. The midmonth Manheim Used Vehicle Value Index dropped to 202.1, which was down 13.8% from the full month of February 2023. The seasonal adjustment added to the decline. The non-adjusted price change in the first half of February rose 0.9% compared to January, while the unadjusted price was down 11.7% year over year.
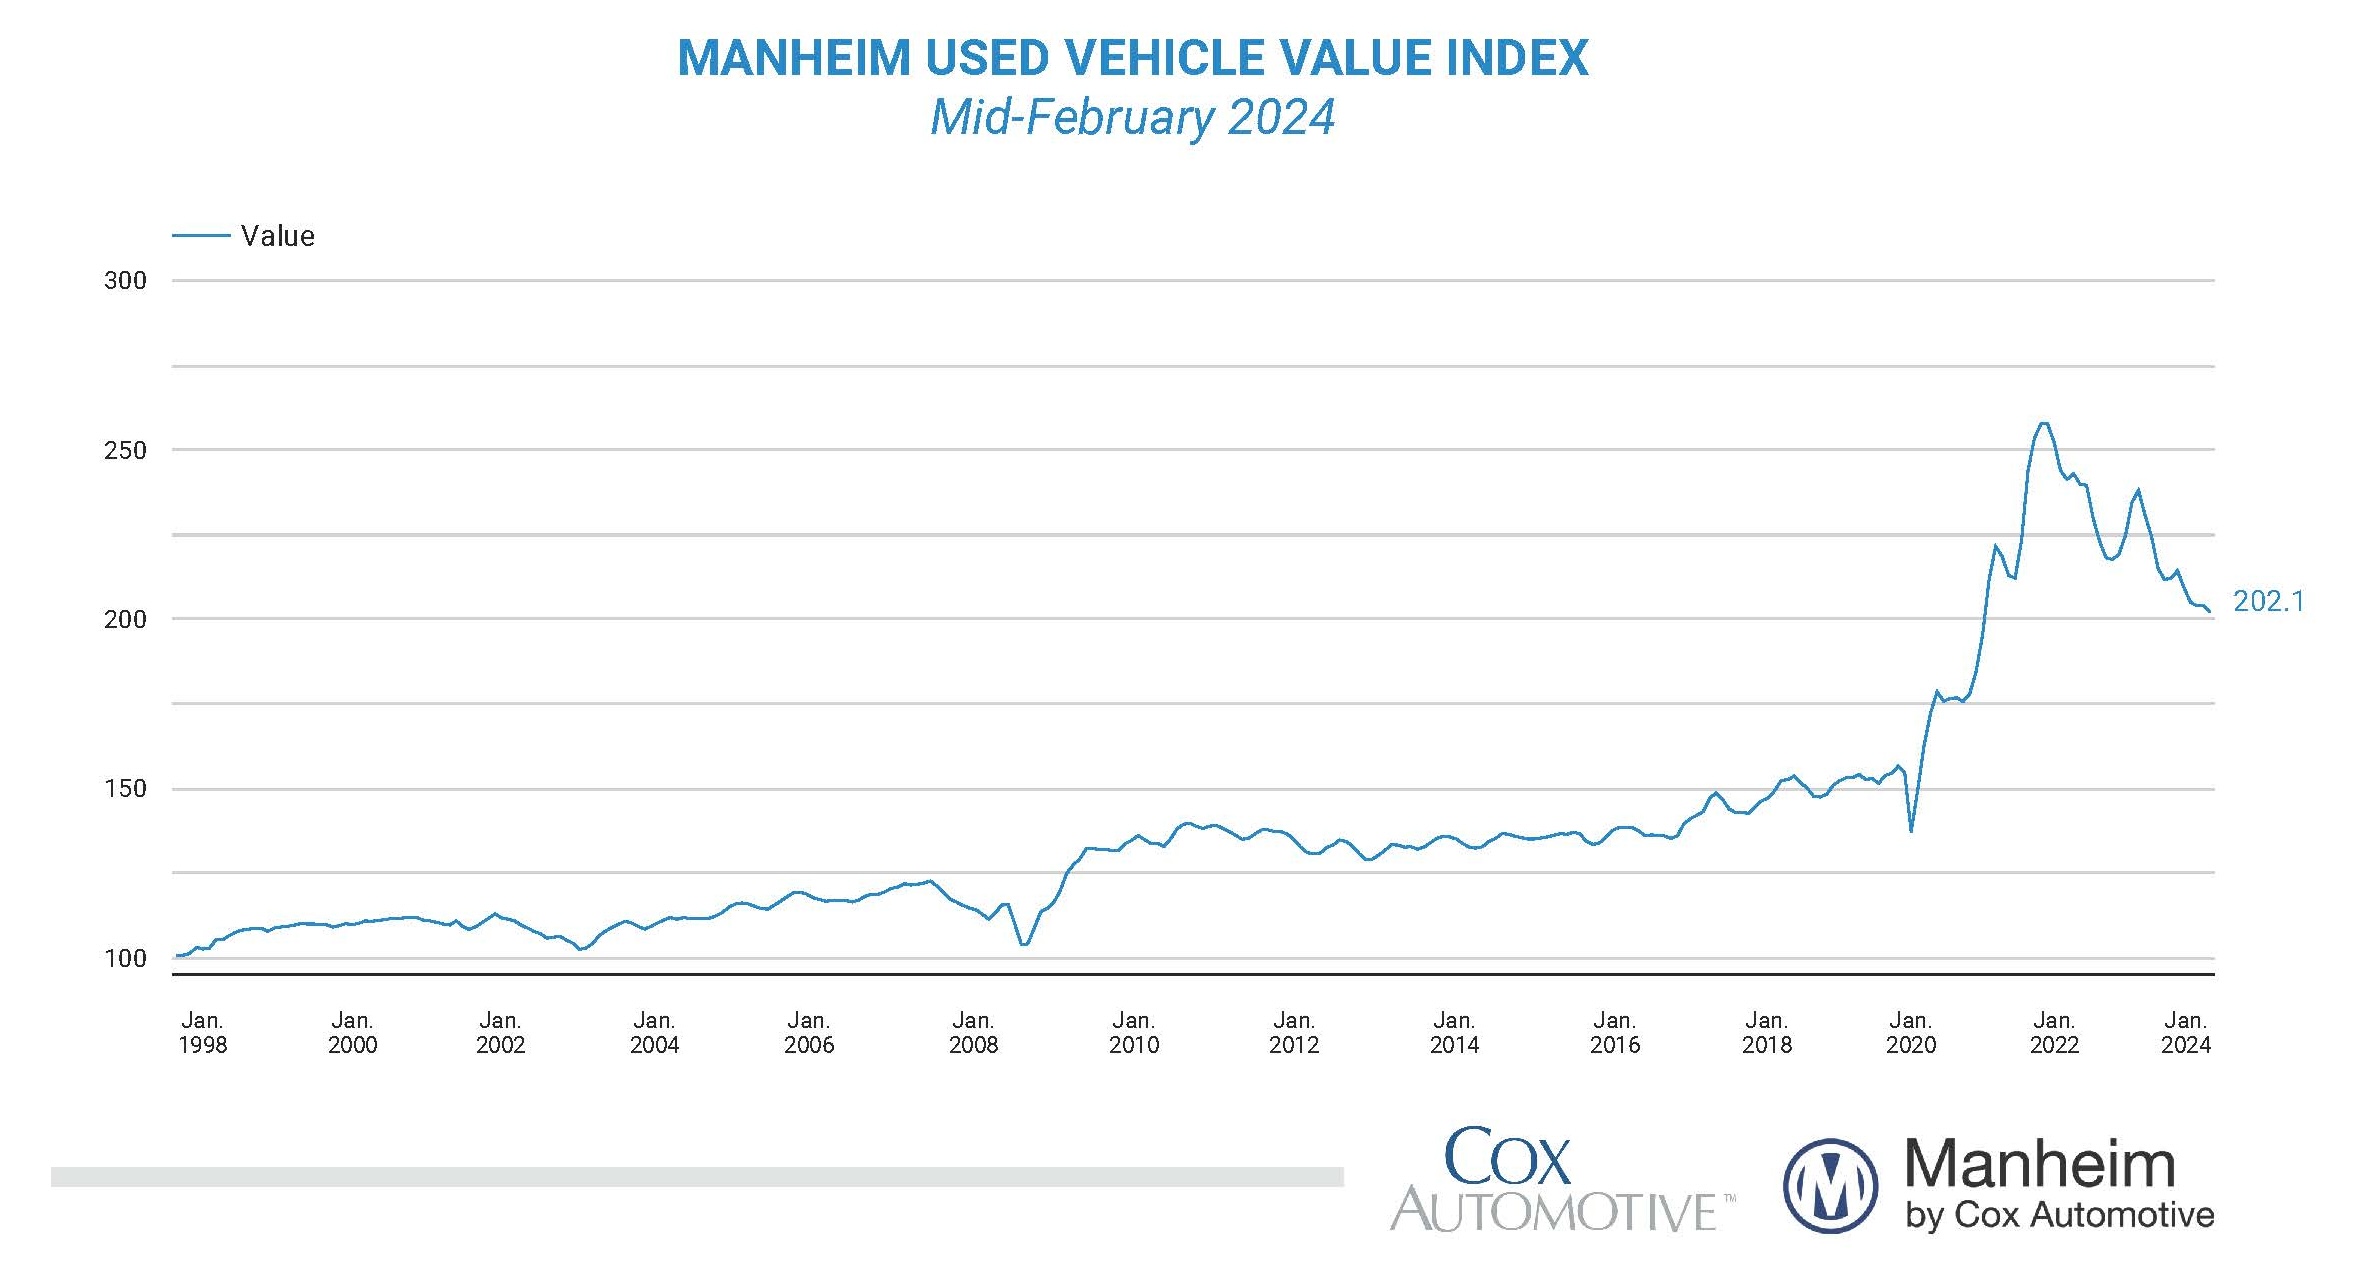
Over the last two weeks, three-year-old Manheim Market Report (MMR) prices increased an aggregate of 0.3%, which was more than the normal decline of 0.2% for the time of year. Over the first 15 days of February, MMR Retention, the average difference in price relative to current MMR, averaged 99.8%, indicating that valuation models are close to market prices. The average daily sales conversion rate of 59.1% in the first half of the month was above the February 2019 daily average of 55.3%. The conversion rate indicates that the first 15 days of the month saw stronger-than-normal buying demand for this time of year.
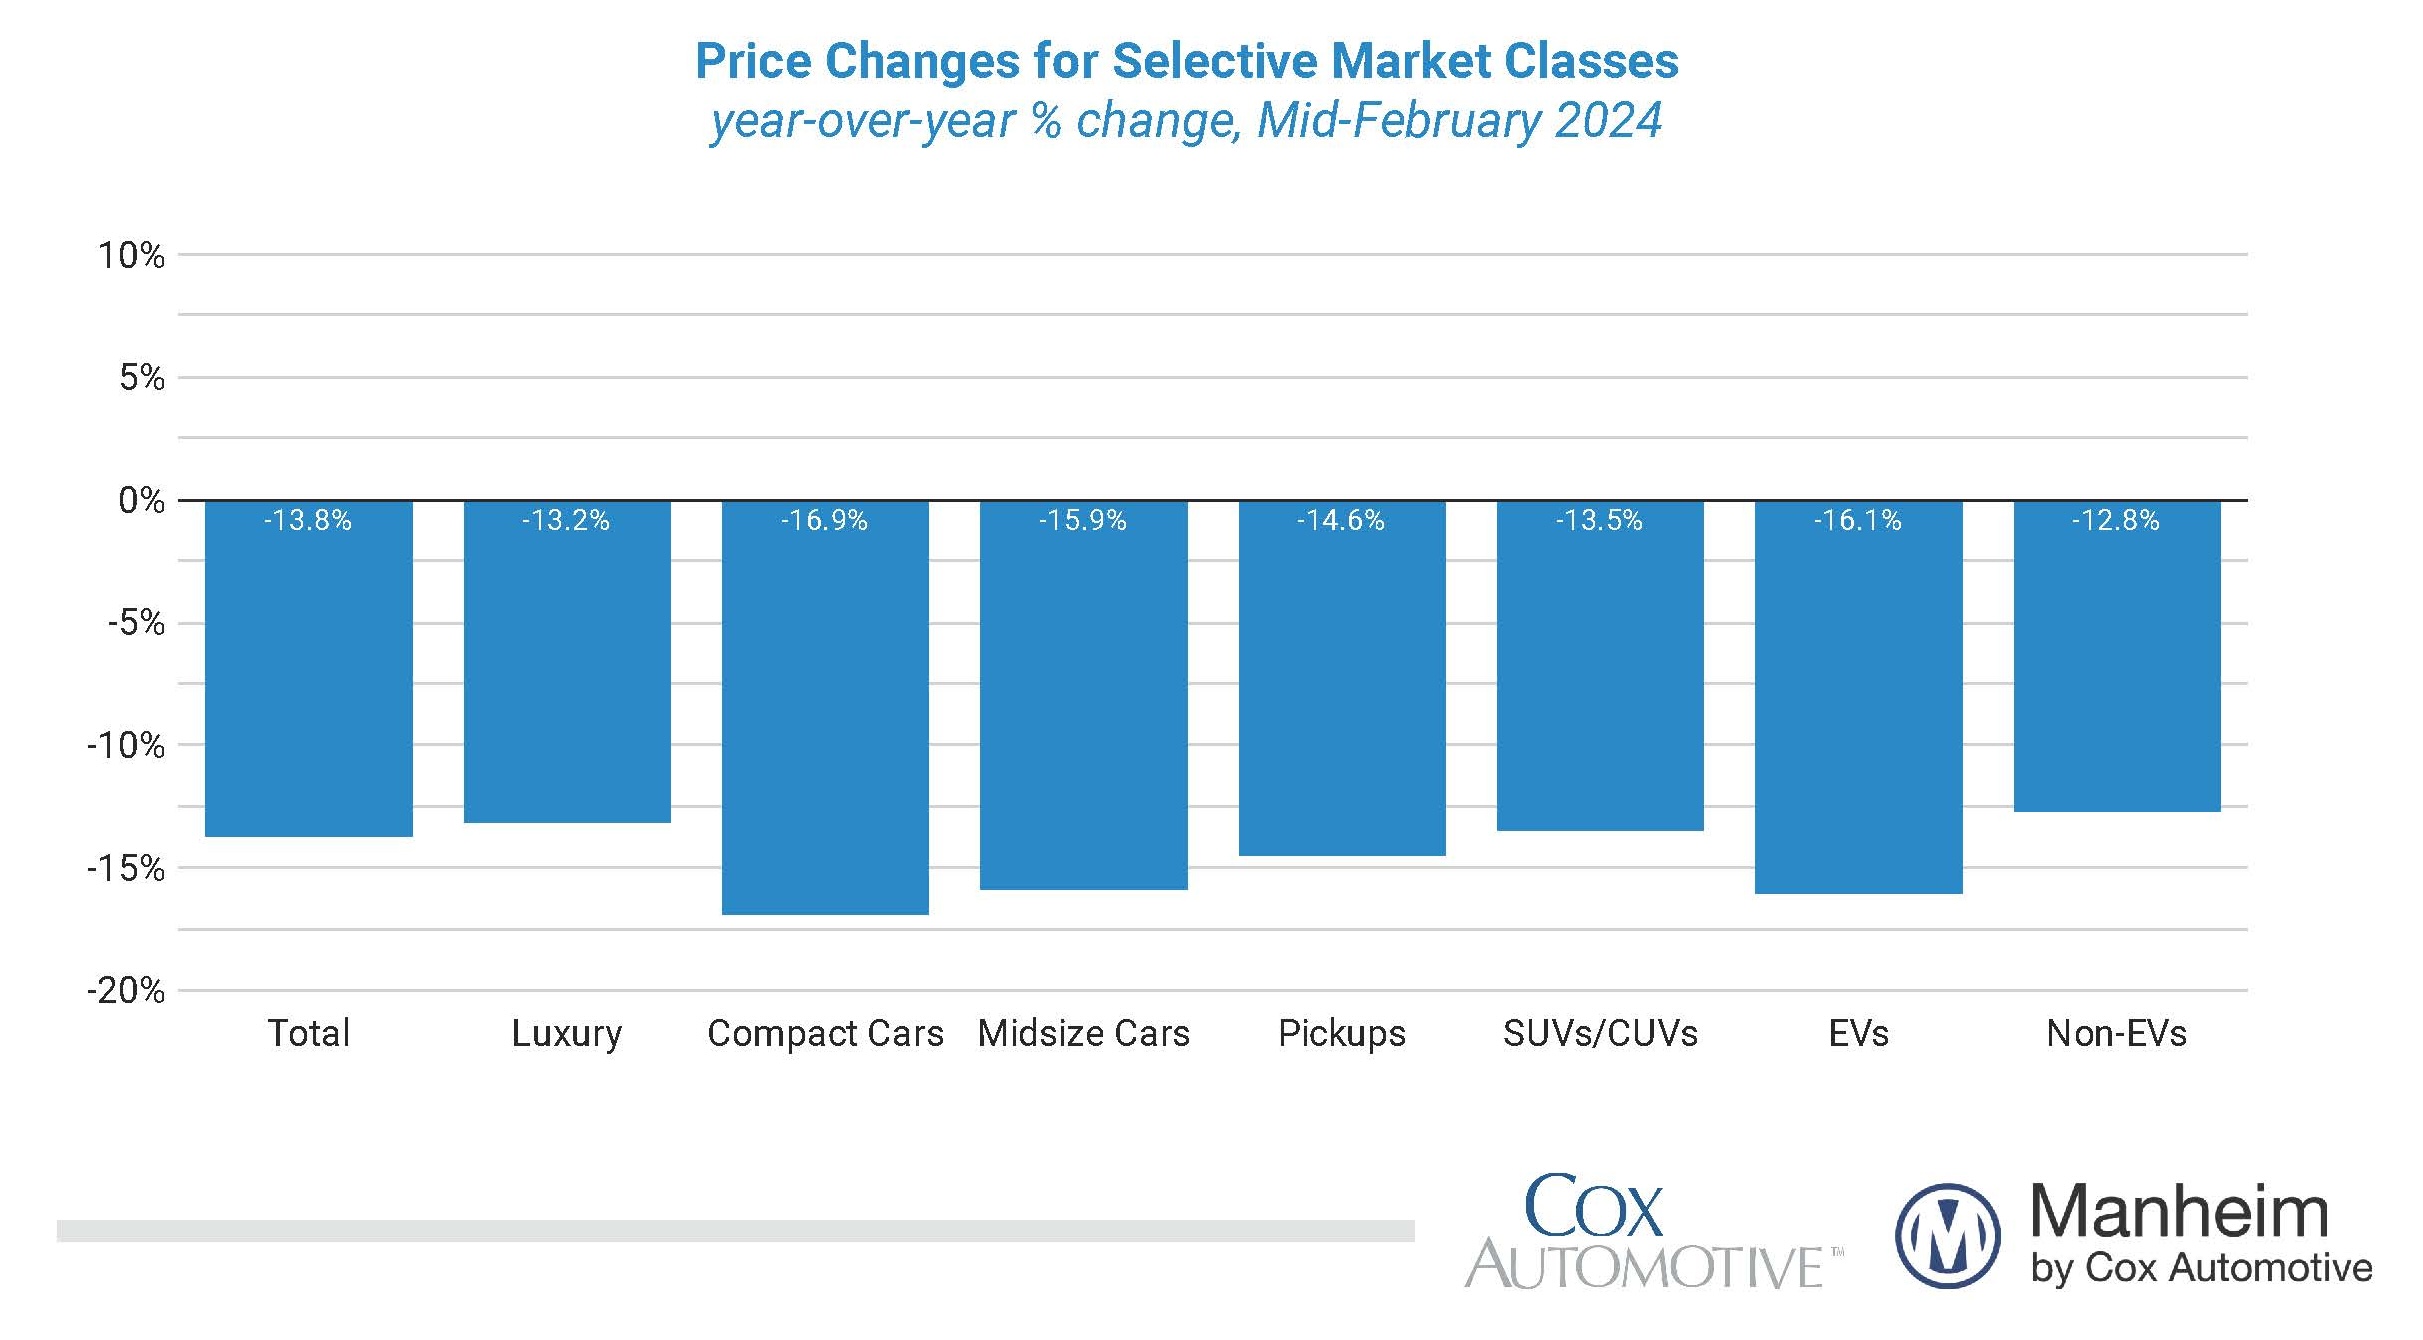
All major market segments saw seasonally adjusted prices that remained lower year over year in the first half of February. Compared to the industry’s year-over-year decline of 13.8%, luxury was down 13.2%, and SUVs declined 13.5%. Faring worse than the industry, compact cars were down 16.9%, midsize cars were off by 15.9%, and pickups lost 14.6% year over year. All major segments saw negative price performance compared to January, with pickups and luxury down 1.7% and 1.1 %, respectively, worse than the 0.9% decline for the industry. Compact cars lost 0.7%, SUVs were down 0.5%, and midsize cars lost 0.1%, all better than the industry. Electric vehicles (EVs) were down 16.1% against values for February 2023, while the non-EV segment declined by 12.8% over the same period. Compared to January, non-EVs declined by 0.6%, while EVs were down only 0.3% over the same period.
Wholesale Supply is Down in Mid-February
Leveraging Manheim sales and inventory data, we estimate that wholesale supply ended January at 28 days, down four days from the end of December and up three days year over year. Wholesale supply is relatively tighter for this time of year. As of Feb. 15, wholesale supply was down one day from the end of January at 27 days and up two days year over year. However, wholesale supply remains down seven days compared to 2019.
Rental Risk Prices Were Mixed in First Two Weeks of February
The average price for rental risk units sold at auction in the first 15 days of February was down 9.4% year over year. Rental risk prices were up by 0.2% compared to the full month of January. Average mileage for rental risk units in the first half of January (at 46,000 miles) was down 24.2% compared to a year ago and up 6.6% month over month.
Consumer Sentiment Up So Far in February
The initial February reading on Consumer Sentiment from the University of Michigan increased 0.8% to 79.6 as views of current conditions declined but future expectations increased. Expectations for inflation increased as the median expected inflation rate over the next year increased to 3.0% from 2.9% last month, but the longer-term view of inflation was steady at 2.9%. Recent inflation data and readings on gas prices in February indicate that consumers are indeed experiencing increases in prices to start the year. However, that is not true for vehicle prices, and the Michigan survey indicates that consumers’ views of buying conditions for vehicles improved to their best level since July 2021. The daily index of consumer sentiment from Morning Consult points to a small increase as well in the first half of February. As of Feb. 15, that index has also increased 0.8% for the month. The average price for unleaded gas has increased 4.3% so far in February, according to AAA; but gas prices are still down 4% year over year.
The complete suite of monthly MUVVI data for February will be released on March 7, 2024, the fifth business day of the month, as regularly scheduled.
For questions or to request data, please email manheim.data@coxautoinc.com. If you want updates about the Manheim Used Vehicle Value Index, as well as direct invitations to the quarterly call sent to you, please sign up for our Cox Automotive newsletter and select Manheim Used Vehicle Value Index quarterly calls.
Note: The Manheim Used Vehicle Value Index was adjusted to improve accuracy and consistency across the data set as of the January 2023 data release. The starting point for the MUVVI was adjusted from January 1995 to January 1997. The index was then recalculated with January 1997 = 100, whereas prior reports had 1995 as the baseline of 100. All monthly and yearly percent changes since January 2015 are identical. Learn more about the decision to rebase the index.


