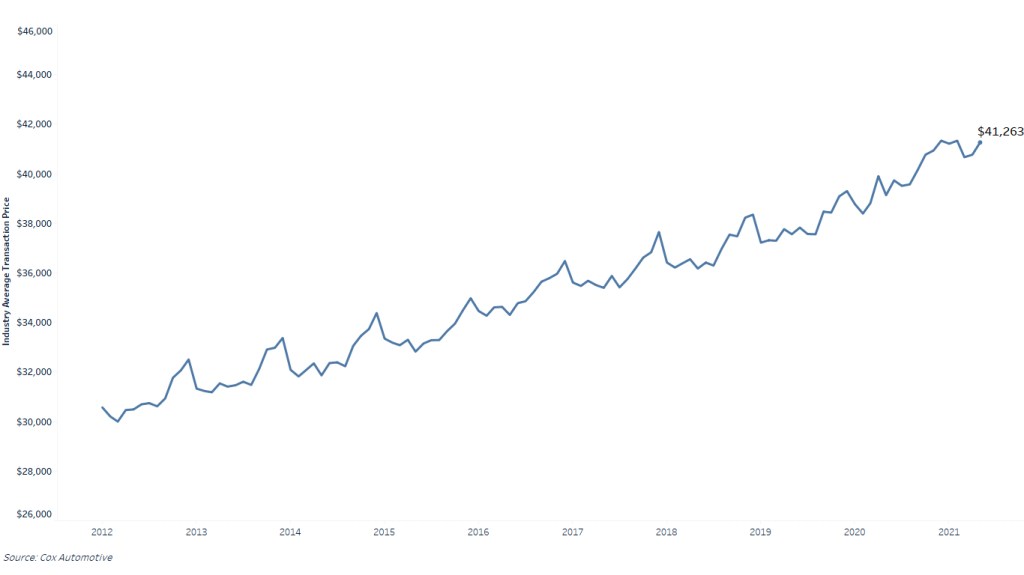
The average new-vehicle transaction price (ATP) in May 2021 increased 5.4% year over year and reached $41,263, according to an analysis by our Kelley Blue Book team. The ATP in May 2021 was an all-time record for the month and the 3rd highest ever, following December 2020 ($41,335) and February 2021 ($41,333). Prices increased 1.2%, or $493, from April 2021. The non-luxury vehicle ATP in May was $38,459, while luxury ATP stood at $56,371. The non-luxury segment increased 4.9% ($1,805) year over year, while luxury saw a 2.9% ($1,597) increase.
The large year-over-year increase in average transaction price in May is particularly noteworthy when vehicle mix is considered. Car share of the total market reached 26% in May 2021, up from 23% a year earlier, while pickup truck share dropped notably, from 22% in May 2020 to 17% in May 2021. A larger share of cars typically drives ATPs lower, but not in May. SUV and Van share of the total market held relatively steady year over year.
With record low new-vehicle inventory, consumers are facing steep prices in the new-vehicle market. Not only did ATPs jump significantly in May, but incentives as a percent of ATP dropped further. According to the Kelley Blue Book analysis, the average new-vehicle incentive in May was 7.4% of ATP, the lowest level in nearly a decade. The average incentive a year ago was 10.7%. Kelley Blue Book calculates the ATP and then determines the average incentive applied. With higher ATPs and lower incentives, vehicle affordability took a hit in May.
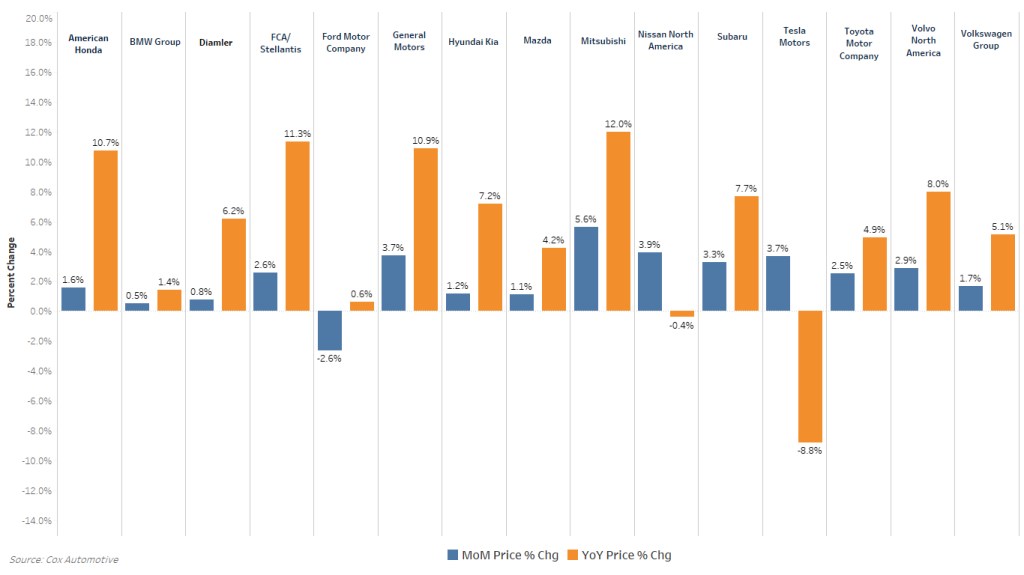
Among individual manufacturers, Mitsubishi saw the largest increase year over year (up 12.0%), while Tesla had the largest drop (8.8%). Earlier this year, Telsa announced priced reductions for its most popular Model 3 and Model Y models, and those lower prices are reflected in the year-over-year data. As Tesla is the dominant force in electric vehicle (EVs), lower year-over-year ATPs at Tesla translate into lower overall EV ATPs, which dropped nearly 11% year over year in May.