Commentary & Voices
Strong Summer Looks Weak Compared to Last Year
Monday September 9, 2019
Article Highlights
- The Manheim Used Vehicle Value Index for August is 141.3, a 1.2% increase from a year ago and a record high for the Index.
- On a year-over-year basis, major market segments saw weak seasonally adjusted price gains in August.
- According to Cox Automotive estimates, total used vehicle sales volume was up 1.8% year over year in August.
Wholesale used vehicle prices (on a mix-, mileage-, and seasonally adjusted basis) increased 0.62% month-over-month in August. This brought the Manheim Used Vehicle Value Index to 141.3, a 1.2% increase from a year ago and a record high for the Index. After seeing stability in July in weekly Manheim Market Report (MMR) prices, depreciation returned in August but at a very low level. Three-year-old vehicle values in aggregate were down 0.5% for the month, when prices normally decline by at least 1%. As a result of low depreciation, prices in aggregate in non-luxury remain higher than the beginning of the year. Last August saw price appreciation, which is why the year-over-year comparison in values is the weakest in more than two years.
On a year-over-year basis, major market segments saw weak seasonally adjusted price gains in August. Luxury cars and pickups outperformed the overall market, while most other major segments underperformed the overall market. Last year continues to be a tough comparison for both prices and sales as we experienced an abnormal increase in consumer demand during the summer driven by tariff fears and rising interest rates. Despite the tough comparison, August reflected a much stronger than normal used retail market for a summer month.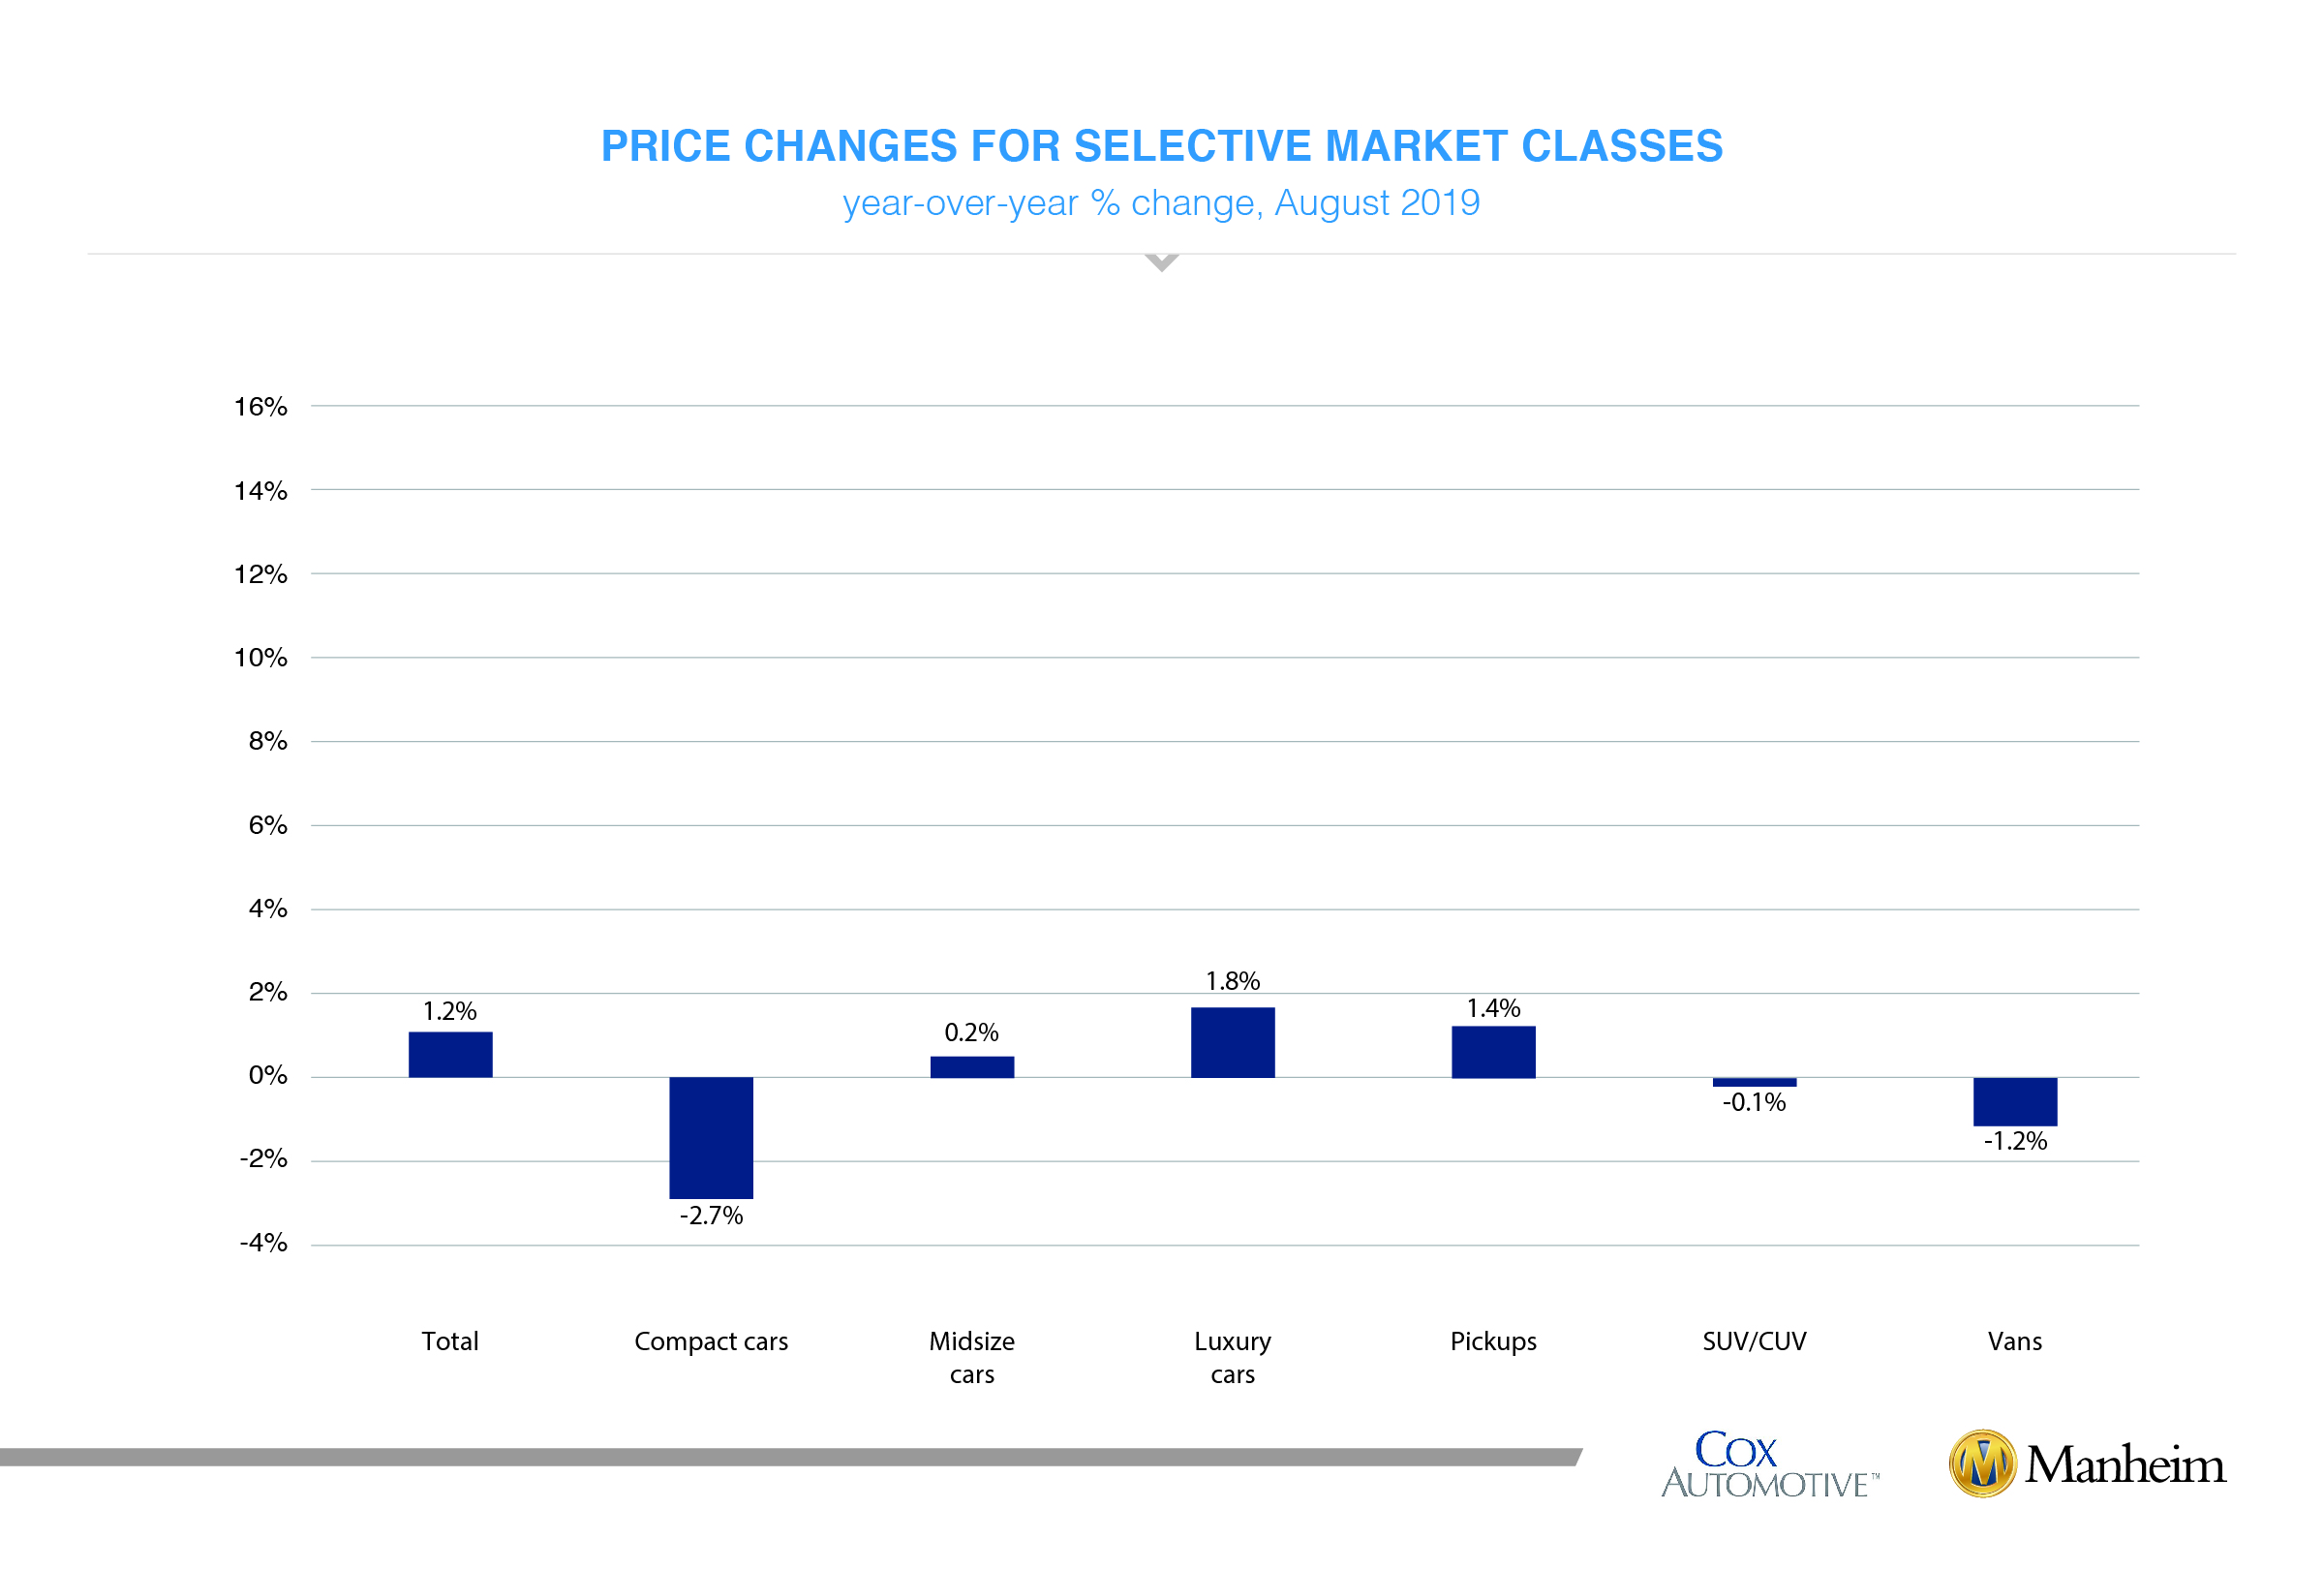
Positive retail results for vehicle sales yea over year. According to Cox Automotive estimates, total used vehicle sales volume was up 1.8% year over year in August. We estimate the August used SAAR to be 39.8 million, up from 39 million last August and up slightly from July’s 39.7 million rate. The August used retail SAAR estimate is 20 million, up from 19.3 million last August and flat month over month.
August total new vehicle sales were up 11% year over year, with one more selling day compared to August 2018 and included Labor Day weekend. The August SAAR came in at 17.0 million, increasing versus last year’s 16.9 million and up slightly from July’s 16.8 million rate. The decline in car sales seems to be bottoming out as car sales in August fell 1% compared to last year. Market share for cars was 27% last month. Light trucks outperformed cars in August, finishing the month up 15% year over year.
Strong fleet sales continue to support the new vehicle market. Combined rental, commercial, and government purchases of new vehicles were up 23% year over year in August. Commercial (+10%) and rental (+45%) fleet channels were up year over year in August. With the highest average incentive in 20 months, retail sales of new vehicles were up 9% in August, leading to a retail SAAR of 14.8 million, down from 14.9 million last August but the strongest retail SAAR since December. Fleet sales are up 7.3% in 2019 through August, and retail sales are down 1.3%, as the overall new vehicle market is up 0.1% this year.
New vehicle inventories came in under 4 million units for the fourth consecutive month and are at the lowest level since August 2016.
Rental risk pricing improves. The average price for rental risk units sold at auction in August was up 0.1% year over year. Rental risk prices were up 1.2% compared to July. Average mileage for rental risk units in August (at 47,700 miles) was up 10% compared to a year ago but down 3% month over month.
Slowing job growth but consumers keep spending. Second-quarter economic growth as measured by GDP was revised down slightly to 2.0% from the originally reported 2.1%. Consumer spending was revised up and played a much larger role than originally estimated as exports, inventories, and residential investment were revised down. Consumer Confidence, as measured by the Conference Board, declined modestly in August by 0.4% to 135.1 from the highest reading so far this year in July. The percentage of households reporting plans to purchase a vehicle in the next six months improved to its best level in three months in August. Purchase intentions remain similar to last year. Plans to buy a house surprisingly fell in August to the lowest level in four months but remain similar to last year.
The Manheim Used Vehicle Value Index data file is available for download.