Wholesale market insights
Manheim Used Vehicle Value Index – August 2018
Monday September 10, 2018
Article Highlights
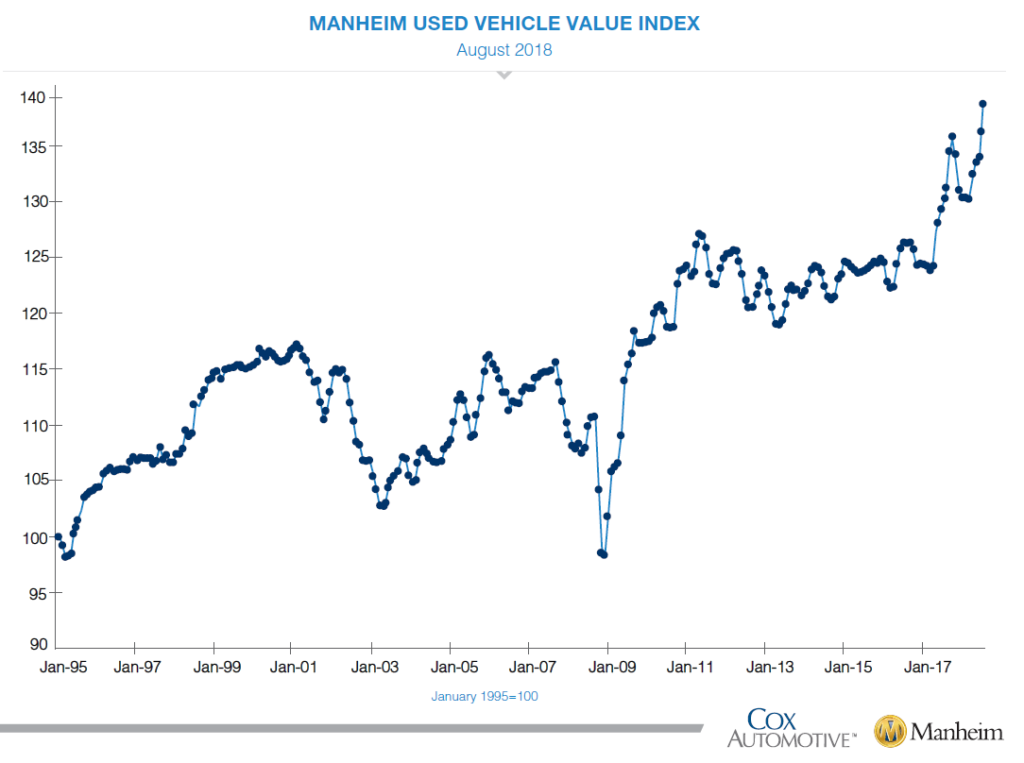
- Wholesale used vehicle prices increased 2.01 percent month-over-month in August. This brought the Manheim Used Vehicle Value Index to 139.7, which was a 6.4 percent increase from a year ago and the highest level for the series over its more than 20-year history.
- According to Cox Automotive estimates, used vehicle sales volume was flat year-over-year in August. August new vehicle sales were also flat year-over-year, with the same number of selling days compared to August 2017. The August SAAR came in at 16.6 million, up slightly versus last year’s 16.5 million. Fleet has been the driver of the strength in the new vehicle market year-to-date, and fleet purchases increased in August relative to July.
- Second-quarter economic growth as measured by GDP was revised up slightly to 4.2 percent from the originally reported 4.1 percent. Consumer Confidence, as measured by the Conference Board, increased in August to 133, the highest since October 2000. The unemployment rate remained very low at 3.9 percent in August, and wage growth accelerated to 2.9 percent.
Used Vehicle Values Set New Record for Second Straight Month
Wholesale used vehicle prices (on a mix-, mileage-, and seasonally adjusted basis) increased 2.01 percent month-over-month in August. This brought the Manheim Used Vehicle Value Index to 139.7, which was a 6.4 percent increase from a year ago and the highest level for the series over its more than 20-year history.
Looking at trends in weekly Manheim Market Report (MMR) prices, the abnormal summer bounce that started in June continued in August. As of Labor Day, 3-year-old vehicles are now worth 4.8 percent more than they would normally be worth had typical depreciation occurred instead of the appreciation observed this year.
The strange summer price appreciation in used cars is partly a function of a strong economy at its peak, with mounting affordability challenges for the consumer that favor growth in used vehicle sales at the expense of new. These conditions have supported strong used vehicle prices for over a year. A key factor behind the vehicle appreciation this summer is the fear of import tariffs’ leading to higher prices in the future. In addition, consumers are also worried about higher interest rates in the months ahead. Combined, these trends encourage buying sooner rather than later. The increase in demand has not been satisfied by flattening wholesale supply and has led to faster moving retail inventory, higher sales efficiency at auction, and higher prices.
On a year-over-year basis, most major market segments saw price gains in August; but more affordable vehicles are seeing the greatest increases in values. Compact cars and midsize cars outperformed the overall market, while vans, utility vehicles, and pickups underperformed the overall market.
Flat results for vehicle sales in August. According to Cox Automotive estimates, used vehicle sales volume was flat year-over-year in August. The annualized pace of used vehicle sales was up 1 percent over last year led by franchised used vehicle sales (up 2 percent in August on an annualized basis) and private-party used vehicle sales (up 4 percent in August on an annualized basis). We estimate the August used SAAR to be 39.6 million, which was flat versus last year.
August new vehicle sales were also flat year-over-year, with the same number of selling days compared to August 2017. The August SAAR came in at 16.6 million, up slightly versus last year’s 16.5 million. Cars continue to see sharp declines as sales in August fell 17 percent compared to last year. The market share for cars came in at 29.4 percent in August, the lowest monthly share in history. Light trucks outperformed cars in August and were up 9 percent year-over-year. New vehicle sales year-to-date are up 1 percent versus last year.
Fleet has been the driver of the strength in the new vehicle market year-to-date, and fleet purchases increased in August relative to July. Despite the monthly increase, the volume of fleet sales was down 3 percent year-over-year but is up 8 percent year-to-date. New vehicle sales into the rental channel were down 21 percent in August versus last year.
New vehicle inventories came in under 4 million units for the fourth consecutive month.
Rental risk pricing strengthens. The average price for rental risk units sold at auction in August was up 8 percent year-over-year. Rental risk prices were up 4 percent compared to July. Average mileage for rental risk units in August (at 43,500 miles) was up 4 percent compared to a year ago but down 4 percent month-over-month.
Continued strong economic momentum. Second-quarter economic growth as measured by GDP was revised up slightly to 4.2 percent from the originally reported 4.1 percent. Personal spending again grew faster than personal income and disposable income, driven by spending gains on prescriptions and food services. The personal savings rate, the net left over after all spending relative to disposable income, fell to 6.7 percent, a low for this year. Consumer Confidence, as measured by the Conference Board, increased in August to 133, the highest since October 2000. The unemployment rate remained very low at 3.9 percent in August, and wage growth accelerated to 2.9 percent.
Featured Solution
Tags
By applying statistical analysis to its database of more than 5 million used vehicle transactions annually, Manheim has developed a measurement of used vehicle prices that is independent of underlying shifts in the characteristics of vehicles being sold. View the index methodology.
The Manheim Index is increasingly recognized by both financial and economic analysts as the premier indicator of pricing trends in the used vehicle market, but should not be considered indicative or predictive of any individual remarketer's results.