Time is money – and one of the most significant ways for dealers to waste both is chasing bad leads. Typically, the biggest problem for dealers isn’t getting enough leads, but rather, how to correctly manage the many they do have and how to distinguish the good leads from the bad ones. While ignoring leads can result in lost sales, there is a balance between following up on poor leads and prioritizing staff time to capitalize on the best chances for sales success.
To avoid falling victim to the bad lead trap, dealers need the ability to distinguish the bad from the good.
Of course, doing so is easier said than done. Sure, it’s easy to eliminate Elvis Presley with the listed contact number 555-1212, but bad leads aren’t always this simple to spot. Customers (including bots) may opt to use plausible but false data. However, not all bad leads are true dead ends. The ease of submitting auto-filled online forms to retrieve hidden data means that one customer can broadly distribute their information to a dozen competitors in a matter of minutes. With a dozen dealers vying for one potential sale, the chance for success is significantly watered down, and in some cases, may not be worth pursuing.
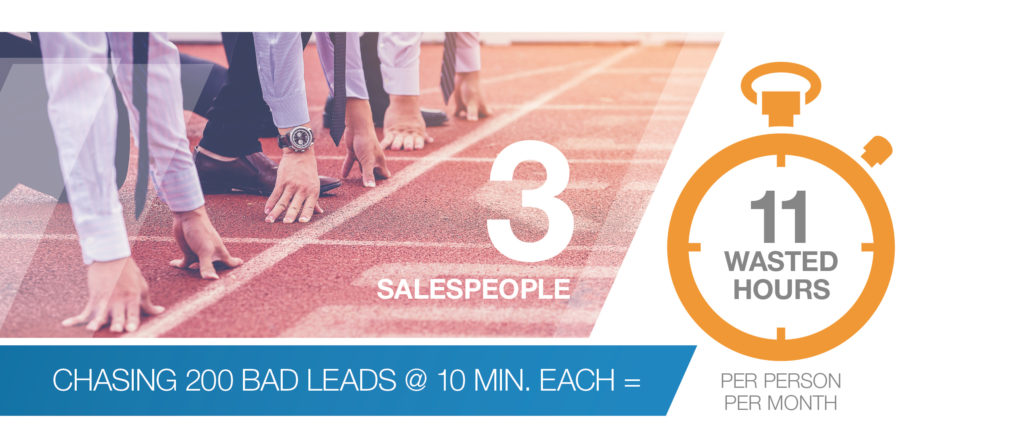
Whether it’s salespeople or dedicated business development center (BDC) staff following up on the leads, the task still takes time away from other potential sales. How long does it take your team to work a bad lead?
Let’s do some napkin math: If you have three salespeople follow up on 200 bad leads per month, at 10 minutes per lead via multiple phone calls and emails, that’s more than 11 hours of time wasted per person each month. Think about what else the team could be doing with 11 hours – like moving units off the lot, for example.
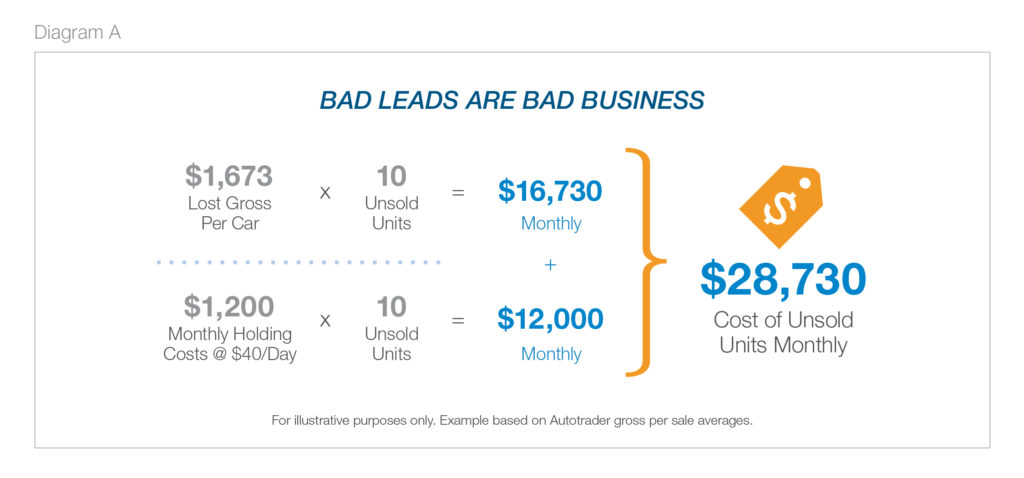
So what does this look like in dollars and cents? Let’s say you have 226 new cars in inventory and sell an average of 76 new cars per month with an average of $1,673 gross profit per vehicle retailed.1 Now factor in holding costs around $40 per day. Just 10 of these units going unsold could cost a dealer $28,730 a month in lost gross plus holding costs (see Diagram A). On top of the sales impact, dealers are still paying for low-quality leads that were never going to close.
HOW DO LEADS GO BAD?
Bad leads come from a variety of sources. Some of the most common bad lead offenders include:
Cattle Call Leads: One customer may send their information to 20 dealerships, yet they still only want to buy one car. People want a dealer to fight for their business, so they cast a wide net and share contact information with multiple dealerships to create inbound inquiries. People using this approach are likely looking for the bottom line best deal, and aren’t serious about in-depth negotiations or conversations about the proposed vehicle with every dealership they contacted.
Privacy Protector Leads: People want to maintain their privacy. They don’t want to be added to a call, texting, email or direct mail list, so instead, include false information like an alias name or defunct email address. Requiring a two-step verification process before giving the information to the consumer is one solution. This encourages providing legitimate contact information but discourages valid customers who want to remain anonymous.
Overly Optimistic Leads: Sometimes potential customers can’t afford the vehicles they’re researching, but they don’t initially realize it. They provide their contact information or make a low-ball offer, as they may not be fully aware that their financial situation is insufficient for the desired car.
Robo Leads: As bots – that is, non-human visits to websites – have become smarter, so has their ability to submit forms, generating bad leads. Bots autonomously complete online forms as part of a click operation, or a number of other fraudulent practices. Using CAPTCHA technology can help deter this practice.
The common thread is that the lead quality is diluted. It only takes a few seconds for someone to provide their information, whether or not it’s legitimate. And yet, these are the leads requiring so much follow up.
WHERE TO FIND GOOD LEADS
To better understand the range of lead quality among third-party solutions, Cox Automotive used aggregated and anonymized data from VinSolutions (which did not include personally identifiable information). Cox Automotive analyzed lead quality for six of the top third-party automotive listing sites. These sites covered 5,985 dealers, both franchise and independent. The analysis found car dealerships received a total of 3,420,653 leads from these six sites in Q1 2019.
SOLD RATES
Only 6.2% of the leads on average, resulted in a sale, though sold rates ranged on the high end from 10.9% on Autotrader to 4% for TrueCar on the low end.
Quality matters over quantity. Despite the fact that TrueCar generated nearly 2.4 times more leads than Autotrader, Autotrader’s sold rate is 172% higher than TrueCar and nearly 60% higher than the industry average (see Diagram B).
Even when the data is adjusted to exclude walk-in traffic to compare the results across sites using only “systematically” created leads (true internet leads), versus those manually input into the CRM to hedge against human error in attributing lead sources, Autotrader’s sold rate (7.6%) is still higher than Edmunds (6%), CarGurus (5.3%), TrueCar (4%) and Cars.com (3.8%).
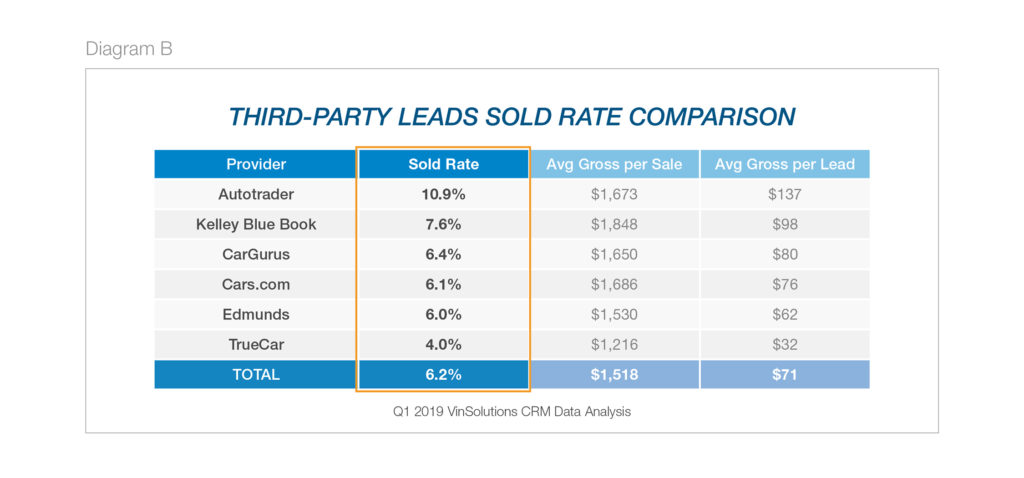
The four lowest sold rates range from 4% to 6.4%, compared to 10.9% for Autotrader, which produced fewer total leads than CarGurus, Cars.com and TrueCar – a clear indicator that lead volume does not equate to lead quality. As a result, dealers must consider the high cost of pursuing bad leads.
By focusing on lead quality, the chances of converting a lead into an actual sale could significantly increase, meaning that the resources spent on acquiring those leads pay off when they become customers. It stands to reason that focusing on lead quality may also increase car buyers’ lifetime value by nurturing relationships and enhancing loyalty with current customers, helping to improve ROI over the long term.
GROSS PROFITS
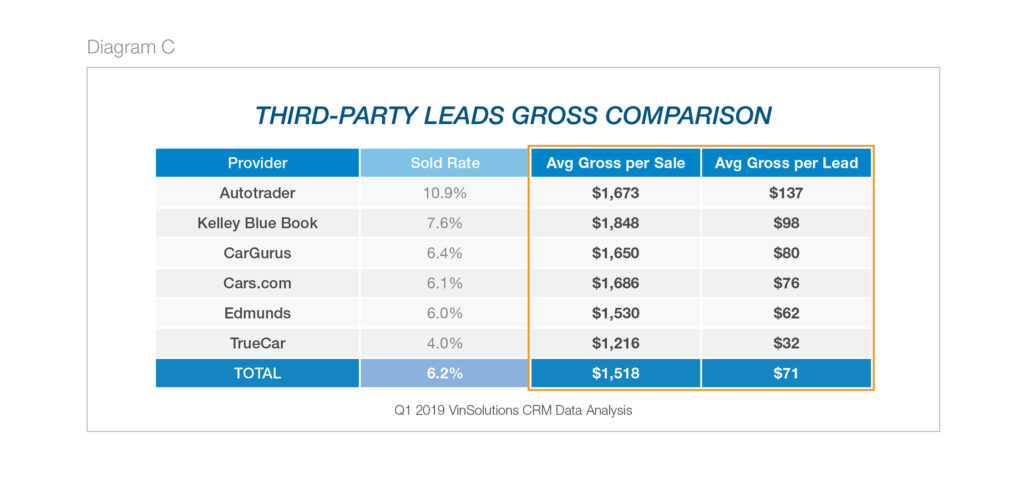
The interesting thing about comparing gross profits isn’t the average gross profit per sale per third-party automotive listing site. Aside from TrueCar’s low average gross of $1,216, the other five sites are between $1,530 and $1,848. The average gross per lead is where the real differences stand out (see Diagram C). Autotrader shows an average gross per lead of $137. That’s $57 more per lead than CarGurus ($80 avg. gross per lead), a 71% increase.
How do you choose quality third-party partners to get the biggest bang for the buck? That’s the million-dollar question. Drilling down to the average gross per lead shows the real difference in quality, along with the sold rates.
The data shows that dealerships should be looking at figures like these to understand how their digital marketing investments with third-party listing sites are paying off.
THE RESIDUAL EFFECT OF BAD LEADS ON DEALERSHIP STAFF
Bad leads don’t just waste time and money – spending time on bad leads is demoralizing for employees, who get no return for the work. In addition to opportunity cost, there are direct labor costs associated with handling these leads. The biggest cost involved with selling a car is paying the staff.2 In fact, on average, for each franchised new car sale, labor costs the dealer $883/year2 whereas the next highest cost – advertising – costs $624 per new car retailed.3 If the sales staff isn’t busy chasing bad leads, they could be busy selling to consumers who are more likely to buy.
Bad leads don’t just cause revenue loss, they may also be contributing to employee turnover, which has its own high cost implications eroding dealer profitability.4 The average turnover for sales staff in a dealership is a dismal 80% annually.5 The problem of chasing bad leads, combined with high turnover, creates a mess for the majority of dealerships.
CUTTING BAD LEADS OFF AT THE SOURCE
The first step in cutting bad leads off at the source is to prioritize lead quality over quantity. Choosing third-party sites that deliver more quality leads with higher close rates and gross per lead should be a non-negotiable for dealers who are dialed in on maximizing profitability. But what you do on those third-party sites can be just as important.
When customer experience is prioritized above lead generation, higher quality leads will follow. One of the worst offenses happening on third-party sites is poor merchandising, and it’s affecting car buyers’ shopping experience, not to mention the negative impact it can have on dealers’ ability to attract high-quality leads.
Providing prospective customers with more information about your listings can yield more positive results, and the proof is in the data. Dealers that include a price on their listings on Autotrader get 53% more vehicle detail page (VDP) views per listing.6 That’s not all: dealers get 65% more VDP views for listings merchandised with multiple custom photos versus stock photos.6
Offering steps to the sale online – a.k.a., digital retailing – is also key to getting quality leads.7 Digital retailing is a great way to get quality leads because it helps educate consumers about a deal before they waste the dealer’s time.
With digital retailing, instead of just showing MSRP, customers can get estimated rates instantly from banks or financial services when the dealership has financial and leasing partners integrated into their system. Customers can plug in their credit range or get a credit check on the site, so the figures are current and accurate. They can decide whether they’re willing to pay $750 per month to finance a car or $450 per month to lease one. The numbers provided to customers through digital retailing are legitimate and tailored to their situation. If they have a car to trade-in, they can provide the vehicle information and get a Kelley Blue Book® Trade-In Value.
After all of this, if a customer still provides his or her contact information, then they’re likely a high-quality lead, which means there’s a greater chance of closing the sale. Customers get to do the work from home, gaining confidence in the trade-in and a personalized monthly payment. When they come into the dealership, they can finalize their deal and complete their purchase. And that’s exactly how car buyers say they’d prefer to buy a car. In fact, 7 in 10 consumers say they are more likely to buy from a dealership if they could start the process online.8
Remember that dealerships are not competing just on price. Yes, price is important, but so is customer loyalty. In 2019, 52% of new vehicle buyers went back to the same dealership they used previously, compared to 39% in 2017.9 For used car buyers, the statistics were 32% in 2019 and 28% in 2017.9 The actual deal they get only represented 20% of the reason for selecting a new vehicle by a repeat brand buyer, and 26% for a new brand buyer.9 The dealership experience was also important to customers and factored into their purchase decision.
It is about creating the experience car buyers want that sets the stage for repeat business. If they have a good experience with the dealership, including their online experience with the dealership – they will likely return to buy their next car and will refer others to do the same. They will come for service. They will buy accessories. They will use financing. Selling one car is not the goal. Selling the dealership to a customer who is buying one car – for now – is the goal.
METHODOLOGY
Cox Automotive has the most comprehensive view of the automotive industry and is able to offer unmatched data and insights into consumer behavior, automotive trends and operational best practices. The analysis provided here used VinSolutions CRM data to evaluate lead volumes and sold rates across primary third-party classified sites.
The analysis also excluded bad or duplicative leads and known VinSolutions test accounts to ensure the data was accurate. It was assumed that some competitors are generating multiple lead records from a single lead submission. No extra steps were taken in this analysis to verify, isolate or separate out duplicates in these instances from the competitors.
Total gross profit includes the sum of both front and back gross, but no specific details of these are provided in the data.