Used Car KPIs from the 2018 Used Car Market Report
12 metrics every dealer needs to track
Friday July 20, 2018
Article Highlights
- Embrace the balance between a vehicle’s desirability and its price. Top performers leverage data to dictate when it is appropriate to “go for the gross” and when the window for profit is short, so they need to price aggressively from the start.
- Solve reconditioning delays. It may require dedicated techs, staying open late or having it done at auction to save time and eliminate logistics. Top performers recognize that speed is paramount.
- Monitor Cost to Market which compares the retail value of a vehicle to the total investment in a vehicle. Efficient dealers minimize costs to enable aggressive acquisition of inventory and deliver maximum ROI.
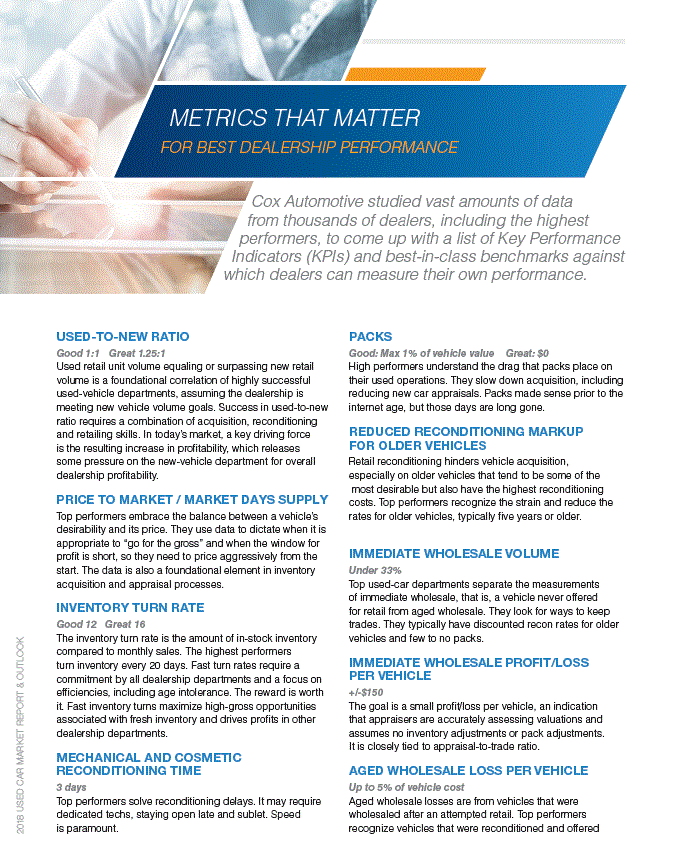
Financial statements. Vendors. OEMs. Your CRM, DMS and BDC. You’re inundated with data and reports, but which metrics matter most? Cox Automotive studied vast amounts of data from thousands of dealers, including the highest performers, to come up with a list of Key Performance Indicators (KPIs) and best-in-class benchmarks.
See how you stack up against the highest performers in the industry. Download the Top 12 Used Car KPIs and Benchmarks below or check out the full report here: 2018 Used Car Market Report & Outlook.
USED-TO-NEW RATIO
Good 1:1 / Great 1.25:1
Used retail unit volume equaling or surpassing new retail volume is a foundational correlation of highly successful used-vehicle departments, assuming the dealership is meeting new vehicle volume goals. Success in used-to-new ratio requires a combination of acquisition, reconditioning and retailing skills. In today’s market, a key driving force is the resulting increase in profitability, which releases some pressure on the new-vehicle department for overall dealership profitability.
PRICE TO MARKET / MARKET DAYS SUPPLY
Top performers embrace the balance between a vehicle’s desirability and its price. They use data to dictate when it is appropriate to “go for the gross” and when the window for profit is short, so they need to price aggressively from the start. The data is also a foundational element in inventory acquisition and appraisal processes.
INVENTORY TURN RATE
Good 12 / Great 16
The inventory turn rate is the amount of in-stock inventory compared to monthly sales. The highest performers turn inventory every 20 days. Fast turn rates require a commitment by all dealership departments and a focus on efficiencies, including age intolerance. The reward is worth it. Fast inventory turns maximize high-gross opportunities associated with fresh inventory and drives profits in other dealership departments.
MECHANICAL AND COSMETIC RECONDITIONING TIME
3 days
Top performers solve reconditioning delays. It may require dedicated techs, staying open late and sublet. Speed is paramount.
PACKS
Good: Max 1% of vehicle value / Great: $0
High performers understand the drag that packs place on their used operations. They slow down acquisition, including reducing new car appraisals. Packs made sense prior to the internet age, but those days are long gone.
REDUCED RECONDITIONING MARKUP FOR OLDER VEHICLES
Retail reconditioning hinders vehicle acquisition, especially on older vehicles that tend to be some of the most desirable but also have the highest reconditioning costs. Top performers recognize the strain and reduce the rates for older vehicles, typically five years or older.
IMMEDIATE WHOLESALE VOLUME
Under 33%
Top used-car departments separate the measurements of immediate wholesale, that is, a vehicle never offered for retail from aged wholesale. They look for ways to keep trades. They typically have discounted recon rates for older vehicles and few to no packs.
IMMEDIATE WHOLESALE PROFIT/LOSS PER VEHICLE
+/-$150
The goal is a small profit/loss per vehicle, an indication that appraisers are accurately assessing valuations and assumes no inventory adjustments or pack adjustments. It is closely tied to appraisal-to-trade ratio.
AGED WHOLESALE LOSS PER VEHICLE
Up to 5% of vehicle cost
Aged wholesale losses are from vehicles that were wholesaled after an attempted retail. Top performers recognize vehicles that were reconditioned and offered for retail but did not sell are likely to lose money. They separate these vehicles from the ones that were immediately wholesaled and set a KPI for the average wholesale loss on these specific units. A benchmark of 5 percent wholesale loss allowance is common. High-performing dealers do not consider a pack adjustment to offset these losses. They want the ability to identify the losers and look for any process adjustments that might prevent future losses.
APPRAISAL-TO-TRADE RATIO
50%+
The appraisal-to-trade ratio is the ratio of all vehicles appraised to how many were traded. Ideally, the metric is tracked by individual appraiser and salesperson. It is a key indicator of the support the used-car department provides to the new-car department. Packs, excessive recon charges and aged used inventory contribute to lower ratios. Another key factor is the point at which the appraisal occurs in the sales process. Dealerships that appraise vehicles early on tend to have lower ratios as they are appraising many more trades.
GROI
Good 120%+ Great 160%+
GROI, or Gross Return on Investment, is the product of the gross as percentage of the sale multiplied by turn rate. For example, a $10,000 vehicle generates a $1,000 profit for a
10 percent gross as a percent of sale. Is that a good job? It depends how long it took to sell. If it took a year, the turn-rate would be one for a GROI of 10. If it sold in one month (a 12-turn equivalent), the GROI would be 120. For a vehicle to make financial sense, the goal is a minimum GROI of 120. This concept can also be applied to an entire inventory.
COST TO MARKET
The highest achievers monitor Cost to Market, which compares the retail value of a vehicle to the total investment in a vehicle, including acquisition cost, reconditioning, transportation, pack, etc. Efficient dealers minimize costs to enable aggressive acquisition of inventory and deliver maximum ROI.


